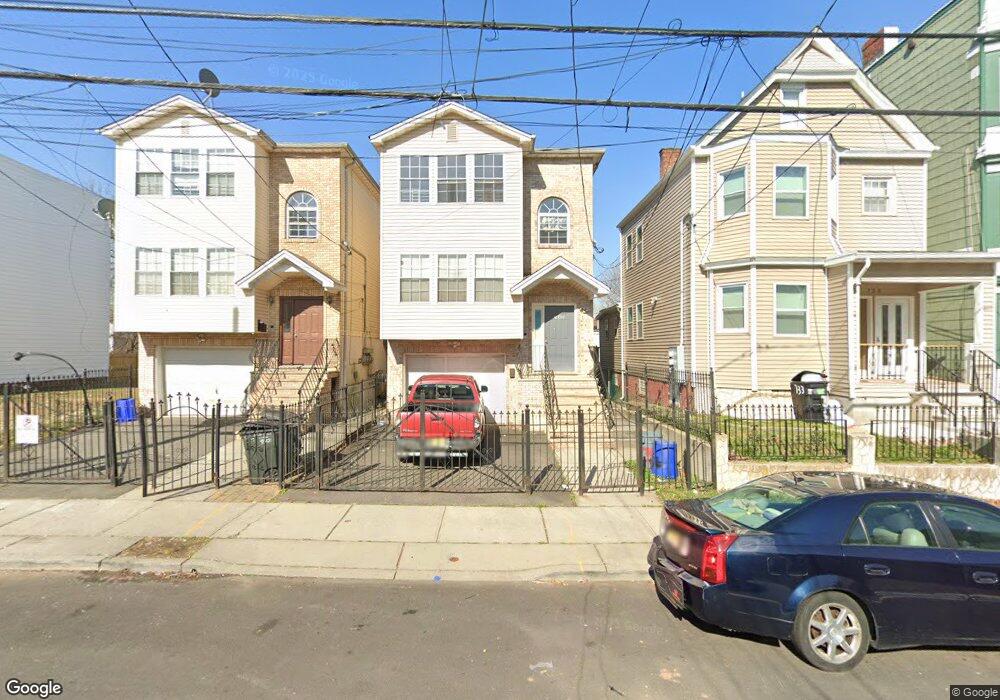
735 S 19th St Newark, NJ 07103
West Side NeighborhoodEstimated Value: $560,000 - $685,000
--
Bed
--
Bath
2,478
Sq Ft
$255/Sq Ft
Est. Value
About This Home
This home is located at 735 S 19th St, Newark, NJ 07103 and is currently estimated at $630,794, approximately $254 per square foot. 735 S 19th St is a home located in Essex County with nearby schools including Hawthorne Avenue Elementary School, Lincoln Elementary School, and Louise A. Spencer School.
Ownership History
Date
Name
Owned For
Owner Type
Purchase Details
Closed on
Jun 29, 2010
Sold by
Costeira Antonio
Bought by
Jacobs Manchester
Current Estimated Value
Purchase Details
Closed on
Dec 16, 2004
Sold by
Vaguiero Luis
Bought by
Costiera Antonio
Purchase Details
Closed on
Oct 1, 2003
Sold by
Tindell John
Bought by
Vagueiro Luis
Create a Home Valuation Report for This Property
The Home Valuation Report is an in-depth analysis detailing your home's value as well as a comparison with similar homes in the area
Home Values in the Area
Average Home Value in this Area
Purchase History
| Date | Buyer | Sale Price | Title Company |
|---|---|---|---|
| Jacobs Manchester | $105,000 | None Available | |
| Costiera Antonio | $329,000 | -- | |
| Vagueiro Luis | $72,000 | -- |
Source: Public Records
Tax History Compared to Growth
Tax History
| Year | Tax Paid | Tax Assessment Tax Assessment Total Assessment is a certain percentage of the fair market value that is determined by local assessors to be the total taxable value of land and additions on the property. | Land | Improvement |
|---|---|---|---|---|
| 2025 | $7,952 | $213,300 | $31,300 | $182,000 |
| 2024 | $7,952 | $213,300 | $31,300 | $182,000 |
| 2022 | $7,969 | $213,300 | $31,300 | $182,000 |
| 2021 | $7,965 | $213,300 | $31,300 | $182,000 |
| 2020 | $8,105 | $213,300 | $31,300 | $182,000 |
| 2019 | $8,022 | $213,300 | $31,300 | $182,000 |
| 2018 | $7,877 | $213,300 | $31,300 | $182,000 |
| 2017 | $7,593 | $213,300 | $31,300 | $182,000 |
| 2016 | $7,338 | $213,300 | $31,300 | $182,000 |
| 2015 | $7,058 | $213,300 | $31,300 | $182,000 |
| 2014 | $6,614 | $213,300 | $31,300 | $182,000 |
Source: Public Records
Map
Nearby Homes
- 737 S 19th St
- 733 S 19th St
- 739 19th
- 739-741 S 19th St
- 731 S 19th St
- 729 S 19th St
- 743 S 19th St
- 727 S 19th St
- 745 S 19th St
- 740 S 20th St
- 730 S 20th St
- 725 S 19th St
- 732 S 20th St Unit 1L
- 732 S 20th St Unit 734
- 732 S 20th St
- 747 S 19th St
- 742 S 20th St
- 728 S 20th St
- 744 S 20th St
- 744 S 20th St Unit 1