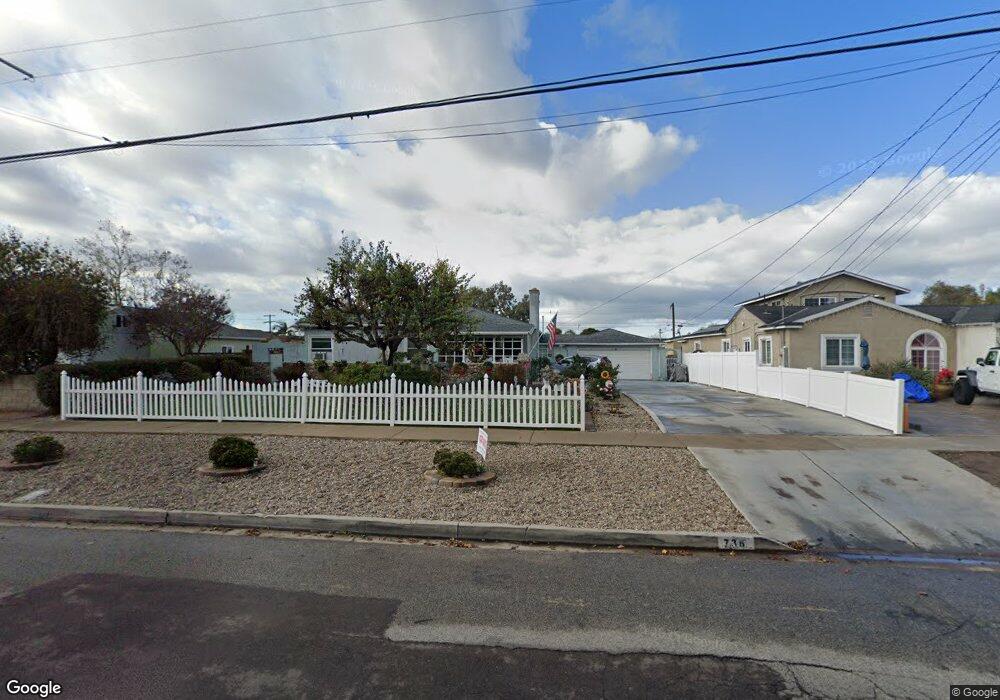
736 1st Ave Chula Vista, CA 91910
Hilltop NeighborhoodEstimated Value: $709,000 - $802,631
3
Beds
2
Baths
1,381
Sq Ft
$559/Sq Ft
Est. Value
About This Home
This home is located at 736 1st Ave, Chula Vista, CA 91910 and is currently estimated at $771,658, approximately $558 per square foot. 736 1st Ave is a home located in San Diego County with nearby schools including Hilltop Drive Elementary School, Hilltop Middle School, and Hilltop Senior High School.
Ownership History
Date
Name
Owned For
Owner Type
Purchase Details
Closed on
May 25, 2018
Sold by
Whitehead Virgil M and Whitehead Maria N
Bought by
Whitehead Virgil M and Whitehead Maria N
Current Estimated Value
Purchase Details
Closed on
Dec 6, 1999
Sold by
Marilyn Whitehead
Bought by
Whitehead Virgil
Purchase Details
Closed on
May 28, 1999
Sold by
Virgil Whitehead
Bought by
Whitehead Virgil W
Purchase Details
Closed on
Jun 19, 1987
Create a Home Valuation Report for This Property
The Home Valuation Report is an in-depth analysis detailing your home's value as well as a comparison with similar homes in the area
Home Values in the Area
Average Home Value in this Area
Purchase History
| Date | Buyer | Sale Price | Title Company |
|---|---|---|---|
| Whitehead Virgil M | -- | None Available | |
| Whitehead Virgil M | -- | None Available | |
| Whitehead Virgil W | -- | None Available | |
| Whitehead Virgil | -- | -- | |
| Whitehead Virgil W | -- | -- | |
| -- | $120,000 | -- |
Source: Public Records
Tax History
| Year | Tax Paid | Tax Assessment Tax Assessment Total Assessment is a certain percentage of the fair market value that is determined by local assessors to be the total taxable value of land and additions on the property. | Land | Improvement |
|---|---|---|---|---|
| 2025 | $734 | $234,241 | $106,799 | $127,442 |
| 2024 | $734 | $229,649 | $104,705 | $124,944 |
| 2023 | $786 | $225,147 | $102,652 | $122,495 |
| 2022 | $856 | $220,734 | $100,640 | $120,094 |
| 2021 | $832 | $216,407 | $98,667 | $117,740 |
| 2020 | $2,404 | $214,189 | $97,656 | $116,533 |
| 2019 | $2,341 | $209,991 | $95,742 | $114,249 |
| 2018 | $2,303 | $205,874 | $93,865 | $112,009 |
| 2017 | $10 | $201,838 | $92,025 | $109,813 |
| 2016 | $2,199 | $197,881 | $90,221 | $107,660 |
| 2015 | $2,167 | $194,909 | $88,866 | $106,043 |
| 2014 | $2,130 | $191,092 | $87,126 | $103,966 |
Source: Public Records
Map
Nearby Homes
- 112 Country Club Dr
- 765 Church Ave
- 633 Del Mar Ave
- 268 Sierra Way
- 617 3rd Ave Unit 14
- 927 Agua Tibia Ave
- 516 Carla Ave
- 202 E J St
- 158 E L St
- 86 Via de Laurencio
- 285 Moss St Unit 9
- 431 Del Mar Ct
- 1054 Cuyamaca Ave
- 1040 2nd Ave
- 279 Moss St Unit 3
- 279 Moss St Unit 10
- 166 Via de Laurencio
- 709 Brightwood Ave
- 520 Glover Ave
- 1017 Helix Ave
Your Personal Tour Guide
Ask me questions while you tour the home.