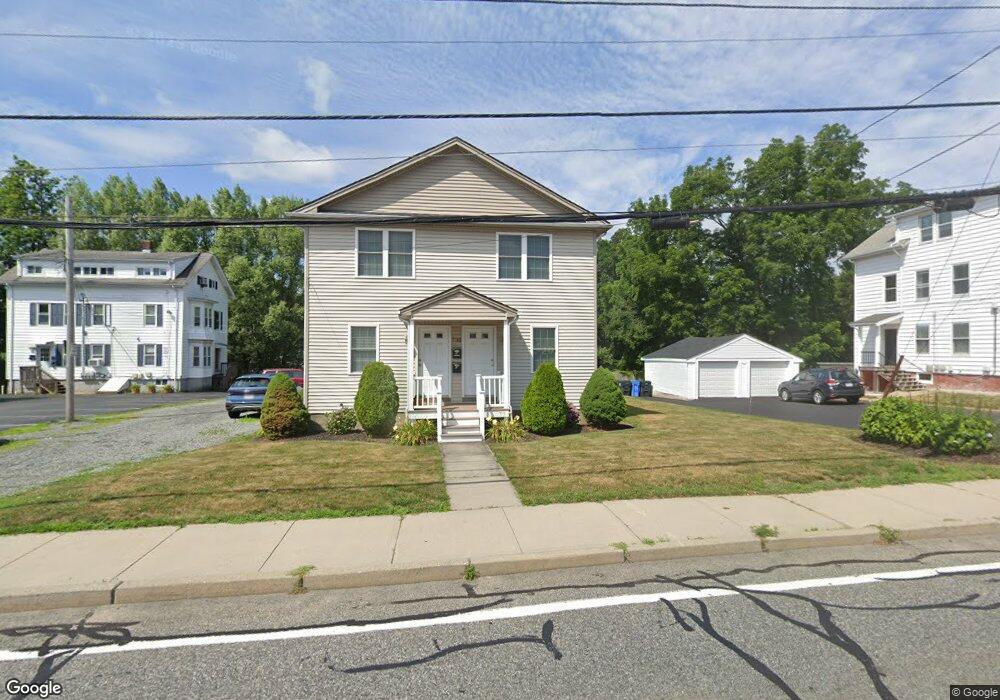
736 High St Cumberland, RI 02864
Valley Falls NeighborhoodEstimated Value: $292,000 - $607,000
5
Beds
4
Baths
624
Sq Ft
$839/Sq Ft
Est. Value
About This Home
This home is located at 736 High St, Cumberland, RI 02864 and is currently estimated at $523,298, approximately $838 per square foot. 736 High St is a home located in Providence County with nearby schools including B.F. Norton Elementary School, Joseph L. McCourt Middle School, and Cumberland High School.
Ownership History
Date
Name
Owned For
Owner Type
Purchase Details
Closed on
Mar 30, 2012
Sold by
Milho Fernando
Bought by
Milho Fernando and Milho Isabel
Current Estimated Value
Purchase Details
Closed on
Apr 13, 2010
Sold by
Farrell Tommy L and Farrell Kelly
Bought by
Milho Fernando
Purchase Details
Closed on
Feb 16, 2007
Sold by
Farrell Frances
Bought by
Tyrrell Tommy and Farrell Kelly J
Home Financials for this Owner
Home Financials are based on the most recent Mortgage that was taken out on this home.
Original Mortgage
$116,000
Interest Rate
6.24%
Mortgage Type
Purchase Money Mortgage
Create a Home Valuation Report for This Property
The Home Valuation Report is an in-depth analysis detailing your home's value as well as a comparison with similar homes in the area
Home Values in the Area
Average Home Value in this Area
Purchase History
| Date | Buyer | Sale Price | Title Company |
|---|---|---|---|
| Milho Fernando | -- | -- | |
| Milho Fernando | $81,000 | -- | |
| Tyrrell Tommy | $145,000 | -- |
Source: Public Records
Mortgage History
| Date | Status | Borrower | Loan Amount |
|---|---|---|---|
| Previous Owner | Tyrrell Tommy | $200,000 | |
| Previous Owner | Tyrrell Tommy | $116,000 | |
| Previous Owner | Tyrrell Tommy | $29,000 |
Source: Public Records
Tax History Compared to Growth
Tax History
| Year | Tax Paid | Tax Assessment Tax Assessment Total Assessment is a certain percentage of the fair market value that is determined by local assessors to be the total taxable value of land and additions on the property. | Land | Improvement |
|---|---|---|---|---|
| 2025 | $5,784 | $471,400 | $128,000 | $343,400 |
| 2024 | $5,633 | $471,400 | $128,000 | $343,400 |
| 2023 | $5,478 | $471,400 | $128,000 | $343,400 |
| 2022 | $5,572 | $371,700 | $91,000 | $280,700 |
| 2021 | $5,479 | $371,700 | $91,000 | $280,700 |
| 2020 | $5,323 | $371,700 | $91,000 | $280,700 |
| 2019 | $4,950 | $311,700 | $65,100 | $246,600 |
| 2018 | $619 | $311,700 | $65,100 | $246,600 |
| 2017 | $4,741 | $311,700 | $65,100 | $246,600 |
| 2016 | $4,388 | $256,900 | $70,300 | $186,600 |
| 2015 | $4,388 | $256,900 | $70,300 | $186,600 |
| 2014 | $4,388 | $256,900 | $70,300 | $186,600 |
| 2013 | $4,340 | $275,000 | $73,200 | $201,800 |
Source: Public Records
Map
Nearby Homes