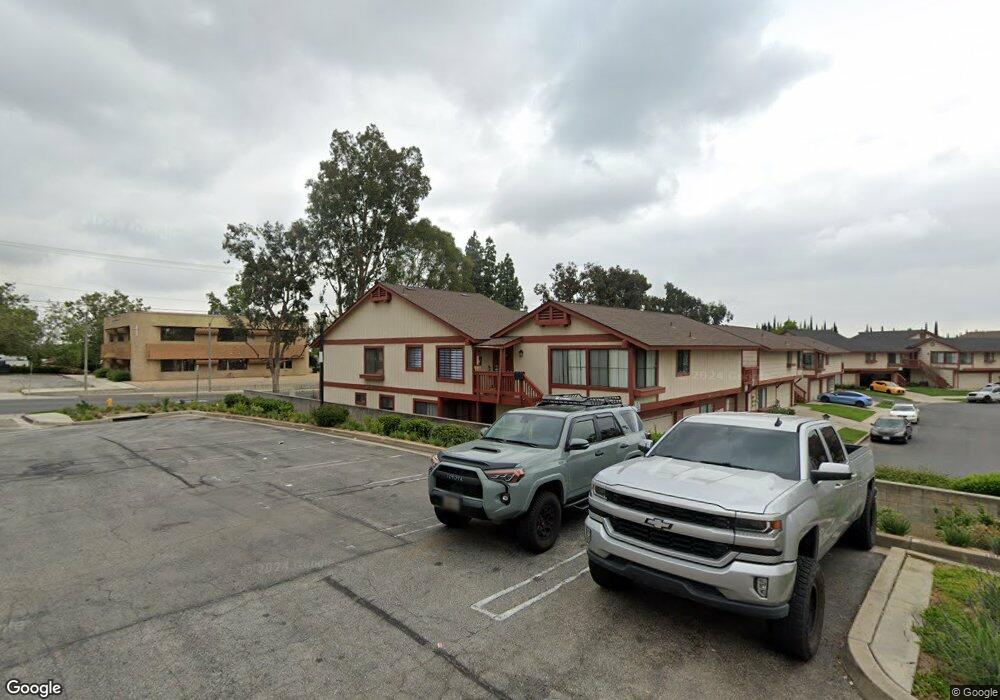
7361 Saddle Rd Unit A Rancho Cucamonga, CA 91730
Estimated Value: $1,129,000 - $1,812,098
2
Beds
2
Baths
4,066
Sq Ft
$378/Sq Ft
Est. Value
About This Home
This home is located at 7361 Saddle Rd Unit A, Rancho Cucamonga, CA 91730 and is currently estimated at $1,538,525, approximately $378 per square foot. 7361 Saddle Rd Unit A is a home located in San Bernardino County with nearby schools including Valle Vista Elementary, Cucamonga Middle, and Alta Loma High.
Ownership History
Date
Name
Owned For
Owner Type
Purchase Details
Closed on
Apr 8, 2008
Sold by
Chen San San and Hwang Yee Ho
Bought by
Huang Paul Y
Current Estimated Value
Home Financials for this Owner
Home Financials are based on the most recent Mortgage that was taken out on this home.
Original Mortgage
$588,000
Interest Rate
5.87%
Mortgage Type
Purchase Money Mortgage
Purchase Details
Closed on
Jan 9, 2007
Sold by
Hwang Susan
Bought by
Hwang Yee Ho
Purchase Details
Closed on
Jan 8, 2007
Sold by
Huang John and Huang Paul
Bought by
Chen San San and Hwang Yee Ho
Purchase Details
Closed on
Jun 1, 2005
Sold by
Huang Judy
Bought by
Huang John
Purchase Details
Closed on
Mar 30, 2005
Sold by
Baza Miguel A and Baza Myrna
Bought by
Huang John and Huang Paul
Home Financials for this Owner
Home Financials are based on the most recent Mortgage that was taken out on this home.
Original Mortgage
$538,000
Interest Rate
5.72%
Mortgage Type
Fannie Mae Freddie Mac
Create a Home Valuation Report for This Property
The Home Valuation Report is an in-depth analysis detailing your home's value as well as a comparison with similar homes in the area
Home Values in the Area
Average Home Value in this Area
Purchase History
| Date | Buyer | Sale Price | Title Company |
|---|---|---|---|
| Huang Paul Y | $850,000 | American Coast Title Company | |
| Hwang Yee Ho | -- | None Available | |
| Chen San San | $850,000 | Spl Title Services | |
| Huang John | -- | Fidelity National Title Co | |
| Huang John | $740,000 | Fidelity National Title Co |
Source: Public Records
Mortgage History
| Date | Status | Borrower | Loan Amount |
|---|---|---|---|
| Previous Owner | Huang Paul Y | $588,000 | |
| Previous Owner | Huang John | $538,000 |
Source: Public Records
Tax History Compared to Growth
Tax History
| Year | Tax Paid | Tax Assessment Tax Assessment Total Assessment is a certain percentage of the fair market value that is determined by local assessors to be the total taxable value of land and additions on the property. | Land | Improvement |
|---|---|---|---|---|
| 2025 | $12,419 | $1,116,494 | $424,268 | $692,226 |
| 2024 | $12,419 | $1,094,602 | $415,949 | $678,653 |
| 2023 | $12,156 | $1,073,139 | $407,793 | $665,346 |
| 2022 | $11,967 | $1,052,097 | $399,797 | $652,300 |
| 2021 | $11,966 | $1,031,468 | $391,958 | $639,510 |
| 2020 | $11,140 | $976,100 | $337,800 | $638,300 |
| 2019 | $10,986 | $947,700 | $328,000 | $619,700 |
| 2018 | $10,298 | $894,000 | $309,400 | $584,600 |
| 2017 | $9,842 | $851,500 | $294,700 | $556,800 |
| 2016 | $9,464 | $811,000 | $280,700 | $530,300 |
| 2015 | $8,677 | $737,300 | $255,200 | $482,100 |
| 2014 | $8,169 | $698,900 | $241,900 | $457,000 |
Source: Public Records
Map
Nearby Homes
- 7236 Hellman Ave
- 9118 Baseline Rd
- 7534 Layton St
- 7430 Leucite Ave
- 7087 Hellman Ave
- 7315 Klusman Ave
- 7355 Vineyard Ave
- 8976 Yew St
- 7730 Layton St
- 9056 La Vine St
- 9599 Church St
- 6953 Saddleback Place
- 7719 Vineyard Ave
- 7795 Malachite Ave
- 9800 Base Line Rd Unit 79
- 7420 London Ave
- 9800 Baseline Rd Unit 71
- 9800 Baseline Rd Unit 17
- 9800 Baseline Rd Unit 82
- 9800 Baseline Rd Unit 62
- 7361 Saddle Rd Unit B
- 7361 Saddle Rd
- 7371 Saddle Rd
- 9267 Spur Dr Unit A
- 9267 Spur Dr
- 7381 Saddle Rd
- 9255 Baseline Rd
- 9255 Baseline Rd Unit G
- 9255 Spur Dr
- 7365 Hellman Ave
- 7386 Saddle Rd
- 7391 Saddle Rd Unit C
- 7391 Saddle Rd
- 7333 Hellman Ave
- 9247 Spur Dr
- 7397 Saddle Rd
- 7385 Lariat Place
- 2 Hellman Ave
- 7405 Saddle Rd
- 9336 Pepper St