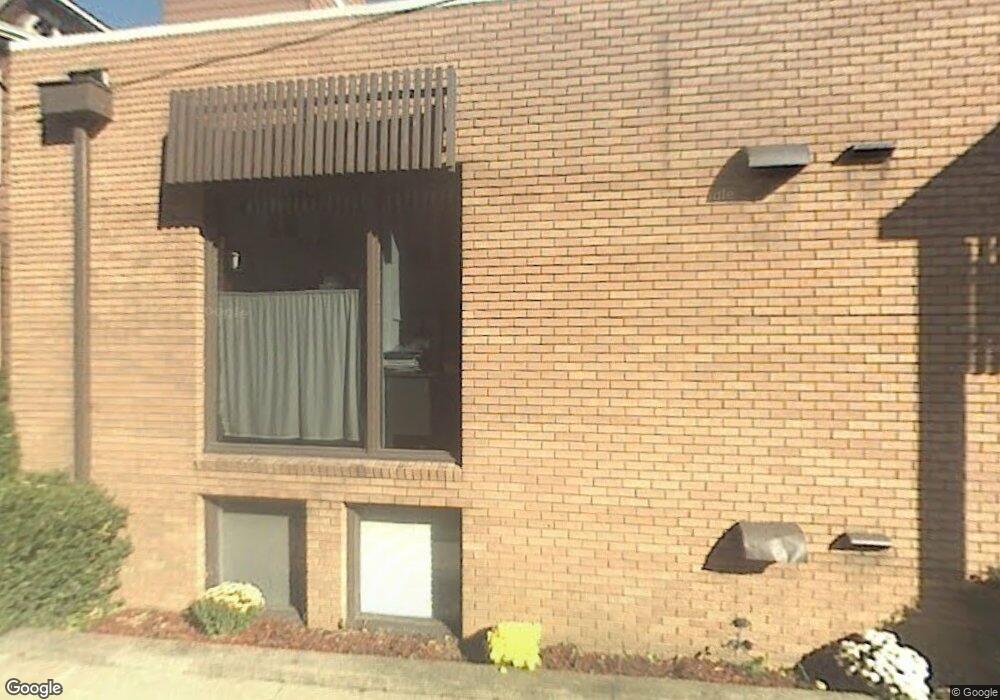
737 E Main St Lancaster, OH 43130
Estimated Value: $275,000
4
Beds
2
Baths
6,552
Sq Ft
$42/Sq Ft
Est. Value
About This Home
This home is located at 737 E Main St, Lancaster, OH 43130 and is currently priced at $275,000, approximately $41 per square foot. 737 E Main St is a home located in Fairfield County with nearby schools including Thomas Ewing Junior High School, Lancaster High School, and St Mary Elementary School.
Ownership History
Date
Name
Owned For
Owner Type
Purchase Details
Closed on
Jun 5, 2018
Sold by
Walker Melissa G
Bought by
Melcor Properties Llc
Current Estimated Value
Purchase Details
Closed on
Apr 27, 2011
Sold by
Walker Robert Philip and Walker Marilyn A
Bought by
Walker Melissa G
Home Financials for this Owner
Home Financials are based on the most recent Mortgage that was taken out on this home.
Original Mortgage
$295,000
Interest Rate
4.77%
Mortgage Type
Future Advance Clause Open End Mortgage
Purchase Details
Closed on
Dec 29, 2010
Sold by
Shoe Center Inc
Bought by
Walker Robert Philip
Create a Home Valuation Report for This Property
The Home Valuation Report is an in-depth analysis detailing your home's value as well as a comparison with similar homes in the area
Home Values in the Area
Average Home Value in this Area
Purchase History
| Date | Buyer | Sale Price | Title Company |
|---|---|---|---|
| Melcor Properties Llc | -- | None Available | |
| Walker Melissa G | $295,000 | Attorney | |
| Walker Robert Philip | -- | Attorney |
Source: Public Records
Mortgage History
| Date | Status | Borrower | Loan Amount |
|---|---|---|---|
| Previous Owner | Walker Melissa G | $295,000 |
Source: Public Records
Tax History
| Year | Tax Paid | Tax Assessment Tax Assessment Total Assessment is a certain percentage of the fair market value that is determined by local assessors to be the total taxable value of land and additions on the property. | Land | Improvement |
|---|---|---|---|---|
| 2025 | $8,163 | $105,210 | $43,540 | $61,670 |
| 2024 | $8,163 | $90,800 | $21,800 | $69,000 |
| 2023 | $4,618 | $90,800 | $21,800 | $69,000 |
| 2022 | $4,657 | $90,800 | $21,800 | $69,000 |
| 2021 | $4,789 | $90,800 | $21,800 | $69,000 |
| 2020 | $1,518 | $90,800 | $21,800 | $69,000 |
| 2019 | $4,446 | $90,800 | $21,800 | $69,000 |
| 2018 | $1,336 | $93,390 | $21,800 | $71,590 |
| 2017 | $4,414 | $92,580 | $21,800 | $70,780 |
| 2016 | $4,265 | $92,580 | $21,800 | $70,780 |
| 2015 | $4,307 | $92,580 | $21,800 | $70,780 |
| 2014 | $4,117 | $92,580 | $21,800 | $70,780 |
| 2013 | $4,117 | $92,580 | $21,800 | $70,780 |
Source: Public Records
Map
Nearby Homes
- 844 E Wheeling St
- 846 E Main St
- 621 E Mulberry St
- 859 E Mulberry St
- 869 E Mulberry St
- 545 E Main St
- 641 King St
- 534 E Wheeling St
- 547 E Mulberry St
- 515 E Chestnut St
- 1106 E Walnut St
- 1113 E Locust St
- 736 E Allen St
- 632 N Eastwood Ave
- 705 Madison Ave
- 517 N Maple St
- 414 E Walnut St
- 342 E Chestnut St
- 403 S Ewing St
- 249 N Pearl Ave
Your Personal Tour Guide
Ask me questions while you tour the home.