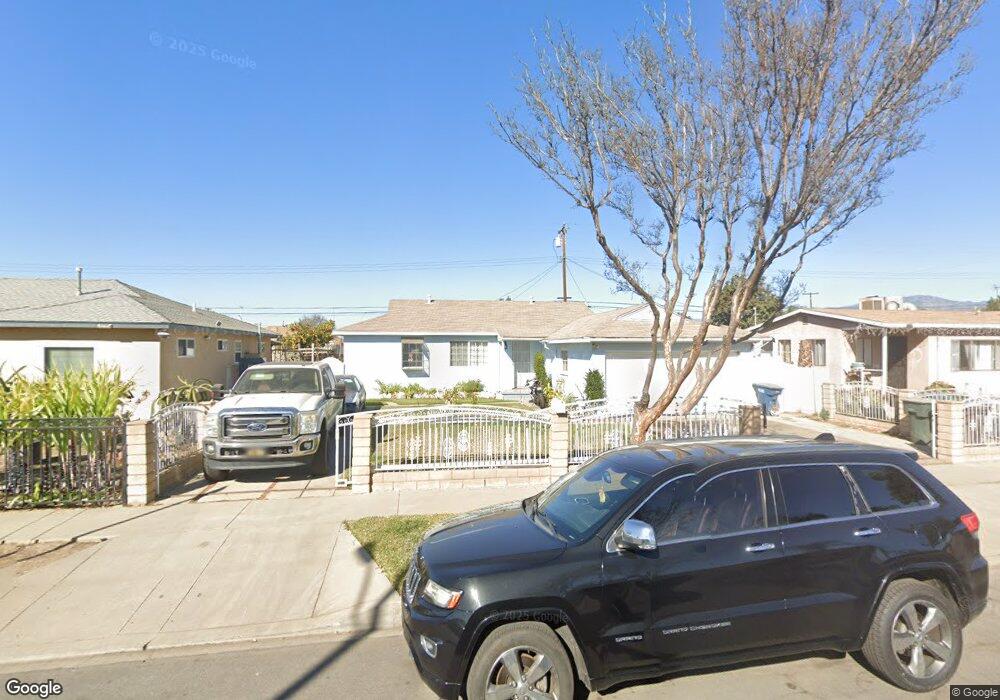
737 Meeker Ave La Puente, CA 91746
Estimated Value: $689,438 - $831,000
3
Beds
2
Baths
1,150
Sq Ft
$667/Sq Ft
Est. Value
About This Home
This home is located at 737 Meeker Ave, La Puente, CA 91746 and is currently estimated at $767,360, approximately $667 per square foot. 737 Meeker Ave is a home located in Los Angeles County with nearby schools including Lassalette Middle School, La Puente High School, and St. Louis of France School.
Ownership History
Date
Name
Owned For
Owner Type
Purchase Details
Closed on
Oct 31, 2025
Sold by
Guillen Roselia and Gonzalez Hector J
Bought by
Roselia Guillen Lemus Living Trust and Hector J Gonzalez Guillen Living Trust
Current Estimated Value
Purchase Details
Closed on
Jun 12, 2014
Sold by
Guillen Roselia
Bought by
Guillen Roselia and Gonzalez Hector J
Purchase Details
Closed on
Mar 28, 2005
Sold by
Rodriguez Ernesto De La Cruz
Bought by
Guillen Roselia
Home Financials for this Owner
Home Financials are based on the most recent Mortgage that was taken out on this home.
Original Mortgage
$170,000
Interest Rate
5.92%
Mortgage Type
New Conventional
Purchase Details
Closed on
Jan 29, 1998
Sold by
Villalpando Camilo
Bought by
Rodriguez Ernesto Delacruz and Guillen Roselia
Home Financials for this Owner
Home Financials are based on the most recent Mortgage that was taken out on this home.
Original Mortgage
$131,204
Interest Rate
6.99%
Mortgage Type
FHA
Create a Home Valuation Report for This Property
The Home Valuation Report is an in-depth analysis detailing your home's value as well as a comparison with similar homes in the area
Home Values in the Area
Average Home Value in this Area
Purchase History
| Date | Buyer | Sale Price | Title Company |
|---|---|---|---|
| Guillen Roselia | -- | None Available | |
| Guillen Roselia | -- | United Independent Title | |
| Rodriguez Ernesto Delacruz | $132,500 | Southland Title Corporation |
Source: Public Records
Mortgage History
| Date | Status | Borrower | Loan Amount |
|---|---|---|---|
| Open | Guillen Roselia | $170,000 | |
| Closed | Rodriguez Ernesto Delacruz | $131,204 |
Source: Public Records
Tax History Compared to Growth
Tax History
| Year | Tax Paid | Tax Assessment Tax Assessment Total Assessment is a certain percentage of the fair market value that is determined by local assessors to be the total taxable value of land and additions on the property. | Land | Improvement |
|---|---|---|---|---|
| 2025 | $3,131 | $232,837 | $119,740 | $113,097 |
| 2024 | $3,131 | $228,273 | $117,393 | $110,880 |
| 2023 | $3,054 | $223,798 | $115,092 | $108,706 |
| 2022 | $2,968 | $219,411 | $112,836 | $106,575 |
| 2021 | $2,912 | $215,110 | $110,624 | $104,486 |
| 2019 | $2,831 | $208,732 | $107,344 | $101,388 |
| 2018 | $2,721 | $204,640 | $105,240 | $99,400 |
| 2016 | $2,526 | $196,695 | $101,154 | $95,541 |
| 2015 | $3,256 | $263,624 | $183,430 | $80,194 |
| 2014 | $2,522 | $189,947 | $97,684 | $92,263 |
Source: Public Records
Map
Nearby Homes
- 610 Willow Ave
- 452 Willow Ave
- 544 N Orange Ave Unit B
- 433 Sunkist Ave
- 14421 Flynn St
- 13903 Moccasin St
- 979 Willow Ave Unit 31
- 943 Willow Ave
- 736 Tonopah Ave
- 335 Willow Ave
- 14510 Amar Rd Unit J
- 13622 Hartsville St
- 14612 Hutchcroft St
- 720 Le Borgne Ave
- 932 Shadydale Ave
- 13426 Austen Way
- 915 Stichman Ave
- 1003 Le Borgne Ave
- 750 Glenshaw Dr
- 1528 W Delvale St