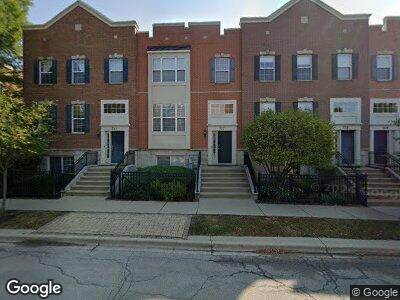
737 Station Blvd Unit 4202 Aurora, IL 60504
Fox Valley NeighborhoodEstimated Value: $412,706 - $437,000
3
Beds
3
Baths
2,104
Sq Ft
$202/Sq Ft
Est. Value
About This Home
This home is located at 737 Station Blvd Unit 4202, Aurora, IL 60504 and is currently estimated at $425,927, approximately $202 per square foot. 737 Station Blvd Unit 4202 is a home located in DuPage County with nearby schools including Owen Elementary School, Thayer J. Hill Middle School, and Metea Valley High School.
Ownership History
Date
Name
Owned For
Owner Type
Purchase Details
Closed on
Jan 12, 2022
Sold by
Maotung Cheng
Bought by
Cheng Maotung and Yang Shim
Current Estimated Value
Purchase Details
Closed on
Oct 29, 2010
Sold by
Cheng Maotung and Yang Shi Ru
Bought by
Cheng Maotung and Yang Shi Ru
Home Financials for this Owner
Home Financials are based on the most recent Mortgage that was taken out on this home.
Original Mortgage
$183,000
Interest Rate
4.36%
Mortgage Type
New Conventional
Purchase Details
Closed on
Jun 5, 2008
Sold by
Yang Shi Ru
Bought by
Cheng Maotung and Yang Shi Ru
Purchase Details
Closed on
Dec 1, 2007
Sold by
The Ryland Group Inc
Bought by
Yang Shi Ru
Home Financials for this Owner
Home Financials are based on the most recent Mortgage that was taken out on this home.
Original Mortgage
$198,518
Interest Rate
6.13%
Mortgage Type
Purchase Money Mortgage
Create a Home Valuation Report for This Property
The Home Valuation Report is an in-depth analysis detailing your home's value as well as a comparison with similar homes in the area
Home Values in the Area
Average Home Value in this Area
Purchase History
| Date | Buyer | Sale Price | Title Company |
|---|---|---|---|
| Cheng Maotung | -- | None Listed On Document | |
| Cheng Maotung | -- | None Available | |
| Cheng Maotung | -- | None Available | |
| Yang Shi Ru | $265,000 | Ryland Title Company |
Source: Public Records
Mortgage History
| Date | Status | Borrower | Loan Amount |
|---|---|---|---|
| Open | Cheng Yafang | $255,000 | |
| Previous Owner | Yang Shi Ru | $183,000 | |
| Previous Owner | Yang Shi Ru | $198,518 |
Source: Public Records
Tax History Compared to Growth
Tax History
| Year | Tax Paid | Tax Assessment Tax Assessment Total Assessment is a certain percentage of the fair market value that is determined by local assessors to be the total taxable value of land and additions on the property. | Land | Improvement |
|---|---|---|---|---|
| 2023 | $7,827 | $104,310 | $28,130 | $76,180 |
| 2022 | $7,369 | $93,870 | $25,310 | $68,560 |
| 2021 | $7,170 | $90,520 | $24,410 | $66,110 |
| 2020 | $7,258 | $90,520 | $24,410 | $66,110 |
| 2019 | $7,522 | $86,100 | $23,220 | $62,880 |
| 2018 | $7,208 | $81,610 | $22,010 | $59,600 |
| 2017 | $7,103 | $78,840 | $21,260 | $57,580 |
| 2016 | $6,996 | $75,660 | $20,400 | $55,260 |
| 2015 | $6,949 | $71,840 | $19,370 | $52,470 |
| 2014 | $6,385 | $64,080 | $17,280 | $46,800 |
| 2013 | $6,315 | $64,520 | $17,400 | $47,120 |
Source: Public Records
Map
Nearby Homes
- 4237 Drexel Ave
- 863 Lewisburg Ln
- 459 Plaza Place
- 442 Plaza Place
- 436 Yorktown Ct Unit 2
- 315 Bunker Hill Cir
- 481 Betsy Ross Ct
- 382 Springlake Ln Unit C
- 372 Springlake Ln Unit C
- 153 Gregory St Unit 17
- 2589 Arcadia Cir Unit 156
- 109 Gregory St Unit 13
- 101 Gregory St Unit 8
- 813 Paisley Ct
- 3433 Bradbury Cir Unit 8048
- 1937 Continental Ave
- 2933 Henley Ln
- 691 Wintergreen Cir
- 639 Conservatory Ln
- 3407 Sandpiper Dr
- 737 Station Blvd Unit 4202
- 741 Station Blvd Unit 4201
- 733 Station Blvd Unit 4203
- 729 Station Blvd Unit 4204
- 725 Station Blvd Unit 4205
- 745 Station Blvd Unit 4105
- 753 Station Blvd Unit 4103
- 753 Station Blvd
- 723 Station Blvd Unit 6501
- 757 Station Blvd Unit 4102
- 761 Station Blvd Unit 4101
- 719 Station Blvd Unit 6503
- 721 Station Blvd Unit 6502
- 775 Lewisburg Ln Unit 4006
- 775 Lewisburg Ln
- 717 Station Blvd Unit 6504
- 4224 Drexel Ave Unit 4402
- 777 Lewisburg Ln Unit 4005
- 4232 Drexel Ave Unit 4404
- 4228 Drexel Ave Unit 4403