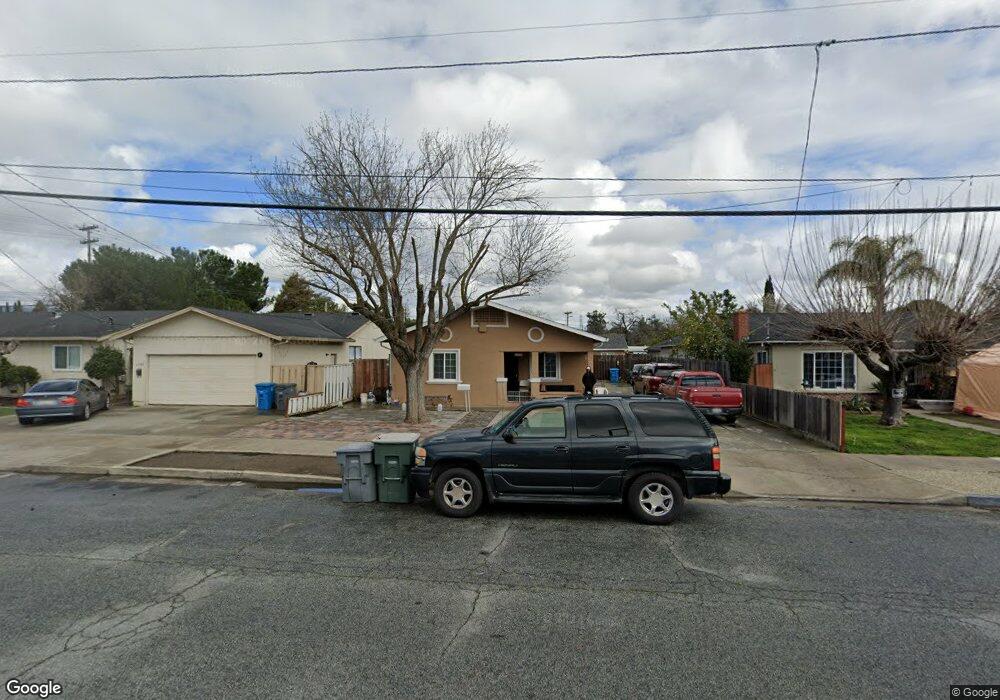
7370 Maple St Gilroy, CA 95020
Estimated Value: $587,000 - $950,000
4
Beds
2
Baths
1,489
Sq Ft
$536/Sq Ft
Est. Value
About This Home
This home is located at 7370 Maple St, Gilroy, CA 95020 and is currently estimated at $798,335, approximately $536 per square foot. 7370 Maple St is a home located in Santa Clara County with nearby schools including Eliot Elementary School, Brownell Middle School, and Solorsano Middle School.
Ownership History
Date
Name
Owned For
Owner Type
Purchase Details
Closed on
May 21, 2019
Sold by
Gallegos Esteban and Gallegos Estevan
Bought by
Gallegos Esteban
Current Estimated Value
Purchase Details
Closed on
Dec 19, 2016
Sold by
Gallegos Esteban
Bought by
Gallegos Esteban and Gallegos Estevan
Purchase Details
Closed on
Feb 9, 2011
Sold by
Zambrano Norma De La Cruz
Bought by
Gallegos Esteban
Purchase Details
Closed on
May 8, 2007
Sold by
Gallegos Esteban
Bought by
Gallegos Esteban and Zambrano Norma De La Cruz
Purchase Details
Closed on
Jul 24, 2000
Sold by
Zambrano Norma
Bought by
Gallegos Esteban
Purchase Details
Closed on
May 18, 2000
Sold by
Stamps Linda G and Stamps Donald
Bought by
Gallegos Esteban
Home Financials for this Owner
Home Financials are based on the most recent Mortgage that was taken out on this home.
Original Mortgage
$282,150
Interest Rate
8.2%
Purchase Details
Closed on
Nov 18, 1999
Sold by
Martin Marie E
Bought by
Martin Marie E and Stamps Linda G
Create a Home Valuation Report for This Property
The Home Valuation Report is an in-depth analysis detailing your home's value as well as a comparison with similar homes in the area
Home Values in the Area
Average Home Value in this Area
Purchase History
| Date | Buyer | Sale Price | Title Company |
|---|---|---|---|
| Gallegos Esteban | $160,000 | None Available | |
| Gallegos Esteban | $189,000 | None Available | |
| Gallegos Esteban | -- | None Available | |
| Gallegos Esteban | -- | None Available | |
| Gallegos Esteban | -- | Chicago Title Co | |
| Gallegos Esteban | $297,000 | Chicago Title Co | |
| Martin Marie E | -- | -- |
Source: Public Records
Mortgage History
| Date | Status | Borrower | Loan Amount |
|---|---|---|---|
| Previous Owner | Gallegos Esteban | $282,150 |
Source: Public Records
Tax History
| Year | Tax Paid | Tax Assessment Tax Assessment Total Assessment is a certain percentage of the fair market value that is determined by local assessors to be the total taxable value of land and additions on the property. | Land | Improvement |
|---|---|---|---|---|
| 2025 | $6,712 | $548,034 | $210,949 | $337,085 |
| 2024 | $6,712 | $537,289 | $206,813 | $330,476 |
| 2023 | $6,673 | $526,755 | $202,758 | $323,997 |
| 2022 | $6,564 | $516,428 | $198,783 | $317,645 |
| 2021 | $6,534 | $506,303 | $194,886 | $311,417 |
| 2020 | $6,463 | $501,112 | $192,888 | $308,224 |
| 2019 | $6,403 | $491,287 | $189,106 | $302,181 |
| 2018 | $5,980 | $481,655 | $185,399 | $296,256 |
| 2017 | $6,017 | $472,212 | $181,764 | $290,448 |
| 2016 | $5,893 | $462,953 | $178,200 | $284,753 |
| 2015 | $5,560 | $456,000 | $175,524 | $280,476 |
| 2014 | $5,523 | $447,068 | $172,086 | $274,982 |
Source: Public Records
Map
Nearby Homes
- 262 E 6th St
- 332 Lewis St Unit 1/2
- 332 Lewis St
- 7621 Forest St
- 0 Monterey Rd
- 160 Sarafina Way
- 0 Pacheco Pass Hwy
- 7191 Eigleberry St
- 194 4th St
- 7711 Monterey St
- 520 Polk Ct
- 7051 Eigleberry St
- 7691 Church St Unit B
- 7630 Hanna St
- 8282 Murray Ave Unit 99
- 8282 Murray Ave Unit 65
- 7681 Hanna St
- 45 Angra Way
- 7310 Carmel St
- 500 W 10th St Unit 177
Your Personal Tour Guide
Ask me questions while you tour the home.