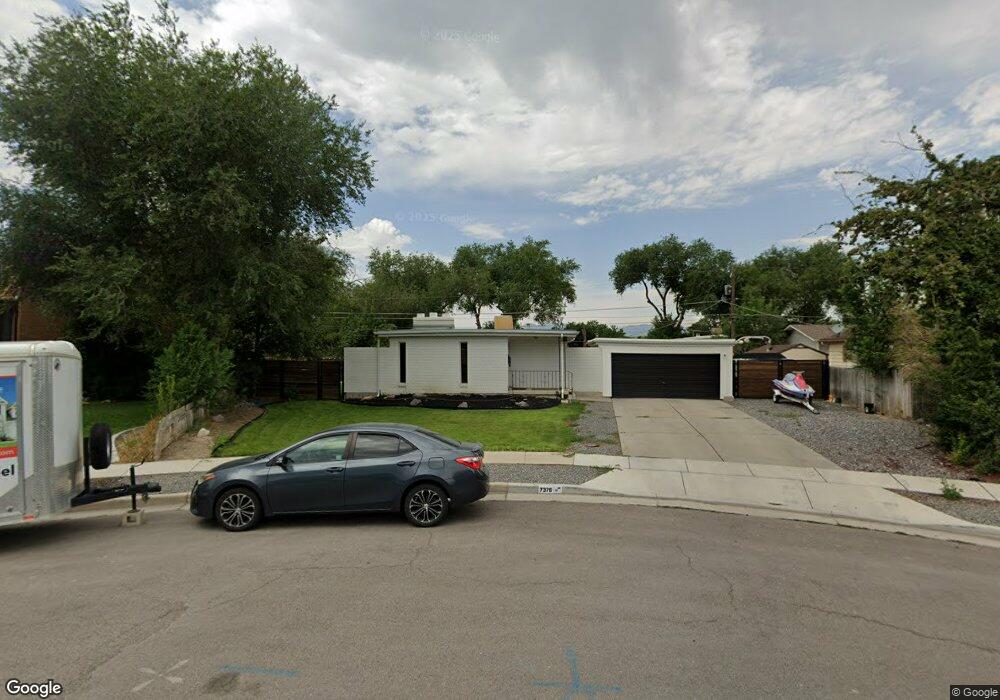
7376 Rusty Dr Midvale, UT 84047
Estimated Value: $492,000 - $535,000
4
Beds
3
Baths
2,059
Sq Ft
$245/Sq Ft
Est. Value
About This Home
This home is located at 7376 Rusty Dr, Midvale, UT 84047 and is currently estimated at $504,289, approximately $244 per square foot. 7376 Rusty Dr is a home located in Salt Lake County with nearby schools including Midvalley Elementary School, Hillcrest High School, and Midvale Middle School.
Ownership History
Date
Name
Owned For
Owner Type
Purchase Details
Closed on
Dec 12, 2019
Sold by
Hoopes Jacob
Bought by
Parris Ryan
Current Estimated Value
Home Financials for this Owner
Home Financials are based on the most recent Mortgage that was taken out on this home.
Original Mortgage
$291,970
Outstanding Balance
$257,917
Interest Rate
3.7%
Mortgage Type
New Conventional
Estimated Equity
$246,372
Purchase Details
Closed on
Oct 1, 2004
Sold by
Adams Roger B and Adams Judy L
Bought by
Hoopes Jacob
Home Financials for this Owner
Home Financials are based on the most recent Mortgage that was taken out on this home.
Original Mortgage
$122,000
Interest Rate
5.12%
Mortgage Type
Unknown
Purchase Details
Closed on
Sep 28, 1995
Sold by
Adams Roger B and Adams Judy
Bought by
Adams Roger B and Adams Judy L
Create a Home Valuation Report for This Property
The Home Valuation Report is an in-depth analysis detailing your home's value as well as a comparison with similar homes in the area
Home Values in the Area
Average Home Value in this Area
Purchase History
| Date | Buyer | Sale Price | Title Company |
|---|---|---|---|
| Parris Ryan | -- | Inwest Title Srvs Layton | |
| Hoopes Jacob | -- | Mt Olympus Title | |
| Adams Roger B | -- | -- |
Source: Public Records
Mortgage History
| Date | Status | Borrower | Loan Amount |
|---|---|---|---|
| Open | Parris Ryan | $291,970 | |
| Previous Owner | Hoopes Jacob | $122,000 | |
| Closed | Hoopes Jacob | $30,500 |
Source: Public Records
Tax History
| Year | Tax Paid | Tax Assessment Tax Assessment Total Assessment is a certain percentage of the fair market value that is determined by local assessors to be the total taxable value of land and additions on the property. | Land | Improvement |
|---|---|---|---|---|
| 2025 | $2,967 | $441,200 | $157,600 | $283,600 |
| 2024 | $2,967 | $422,500 | $147,900 | $274,600 |
| 2023 | $2,883 | $411,400 | $140,700 | $270,700 |
| 2022 | $2,969 | $421,500 | $137,900 | $283,600 |
| 2021 | $2,648 | $319,000 | $137,900 | $181,100 |
| 2020 | $2,451 | $287,400 | $92,100 | $195,300 |
| 2019 | $2,137 | $267,700 | $86,900 | $180,800 |
| 2016 | $1,699 | $200,600 | $86,900 | $113,700 |
Source: Public Records
Map
Nearby Homes
- 106 E 7320 S
- 72 E 7320 S
- 7377 S Ramanee Dr
- 110 Greenwood Ave
- 7479 S Randall Cir
- 220 E Greenwood Ave
- 30 W 7500 S Unit 18
- 7214 S 160 E
- 120 E 7615 St S Unit 103
- 221 E Fort Union Blvd
- 7359 S Dewmar Ct W Unit 32
- 489 E 7800 S Unit 2
- 7363 S Dewmar Ct W Unit 33
- 7342 S Seven Tree Ln W Unit 77
- 7329 S Seven Tree Ln W Unit 85
- 7371 S Dewmar Ct W Unit 35
- 7327 S Seven Tree Ln W Unit 86
- 7337 S Seven Tree Ln W Unit 82
- 7343 S Seven Tree Ln Unit 79
- 7355 S Dewmar Ct W Unit 31
Your Personal Tour Guide
Ask me questions while you tour the home.