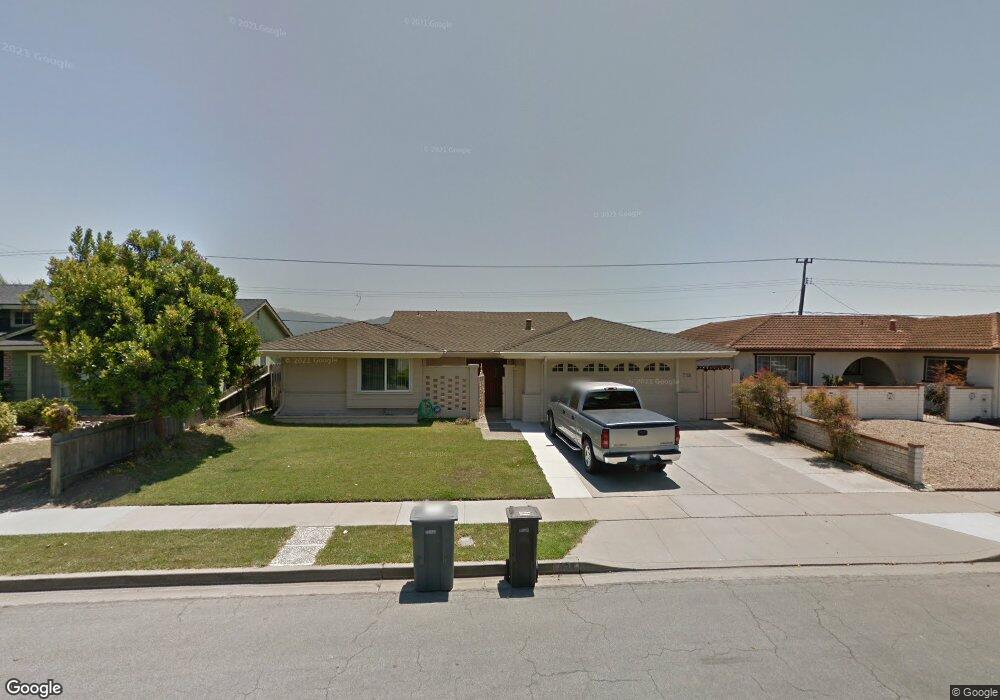
738 La Mesa Dr Salinas, CA 93901
South Salinas NeighborhoodEstimated Value: $806,640 - $887,000
3
Beds
3
Baths
1,723
Sq Ft
$490/Sq Ft
Est. Value
About This Home
This home is located at 738 La Mesa Dr, Salinas, CA 93901 and is currently estimated at $843,910, approximately $489 per square foot. 738 La Mesa Dr is a home located in Monterey County with nearby schools including Monterey Park Elementary School, Lincoln Elementary School, and Mission Park Elementary School.
Ownership History
Date
Name
Owned For
Owner Type
Purchase Details
Closed on
Dec 19, 2017
Sold by
Saavedra Manuel M and Saavedra Maria E
Bought by
Saavedra Manuel M and Saavedra Maria Elena
Current Estimated Value
Purchase Details
Closed on
Feb 27, 2001
Sold by
Barlow Larry D and Barlow Sarah D
Bought by
Saavedra Manuel M and Saavedra Maria E
Home Financials for this Owner
Home Financials are based on the most recent Mortgage that was taken out on this home.
Original Mortgage
$246,000
Interest Rate
7.12%
Purchase Details
Closed on
Feb 4, 2000
Sold by
Cavallas Lillian E and Lillian E Cavallas Living Trus
Bought by
Barlow Larry E and Barlow Sarah D
Home Financials for this Owner
Home Financials are based on the most recent Mortgage that was taken out on this home.
Original Mortgage
$199,000
Interest Rate
3.95%
Create a Home Valuation Report for This Property
The Home Valuation Report is an in-depth analysis detailing your home's value as well as a comparison with similar homes in the area
Home Values in the Area
Average Home Value in this Area
Purchase History
| Date | Buyer | Sale Price | Title Company |
|---|---|---|---|
| Saavedra Manuel M | -- | None Available | |
| Saavedra Manuel M | $336,000 | Old Republic Title Company | |
| Barlow Larry E | $250,000 | Old Republic Title Company |
Source: Public Records
Mortgage History
| Date | Status | Borrower | Loan Amount |
|---|---|---|---|
| Previous Owner | Saavedra Manuel M | $246,000 | |
| Previous Owner | Barlow Larry E | $199,000 |
Source: Public Records
Tax History
| Year | Tax Paid | Tax Assessment Tax Assessment Total Assessment is a certain percentage of the fair market value that is determined by local assessors to be the total taxable value of land and additions on the property. | Land | Improvement |
|---|---|---|---|---|
| 2025 | $5,718 | $506,277 | $210,949 | $295,328 |
| 2024 | $5,718 | $496,351 | $206,813 | $289,538 |
| 2023 | $5,524 | $486,619 | $202,758 | $283,861 |
| 2022 | $5,316 | $477,079 | $198,783 | $278,296 |
| 2021 | $5,105 | $467,726 | $194,886 | $272,840 |
| 2020 | $4,963 | $462,931 | $192,888 | $270,043 |
| 2019 | $4,927 | $453,855 | $189,106 | $264,749 |
| 2018 | $4,864 | $444,957 | $185,399 | $259,558 |
| 2017 | $4,867 | $436,233 | $181,764 | $254,469 |
| 2016 | $4,869 | $427,680 | $178,200 | $249,480 |
| 2015 | $4,911 | $421,257 | $175,524 | $245,733 |
| 2014 | $3,908 | $353,000 | $147,000 | $206,000 |
Source: Public Records
Map
Nearby Homes
- 646 Santa Cruz Ave
- 323 San Miguel Ave
- 612 Alameda Ave
- 207 Encinada Dr
- 333 Hawthorne St
- 321 Hawthorne St
- 14 San Juan Dr
- 57 Carmel Ave
- 54 Katherine Ave
- 50 Katherine Ave
- 202 Pine St
- 1 Santa Lucia Ave
- 36 Pine St
- 15 Del Rey Cir
- 1067 Padre Dr Unit 2
- 1067 Padre Dr Unit 1
- 1051 Padre Dr Unit 7
- 123 Chestnut St
- 1056 Padre Dr Unit 4
- 141 Del Mar Dr
- 732 La Mesa Dr
- 744 La Mesa Dr
- 726 La Mesa Dr
- 737 La Mesa Dr
- 743 La Mesa Dr
- 720 La Mesa Dr
- 756 La Mesa Dr
- 749 La Mesa Dr
- 725 La Mesa Dr
- 714 La Mesa Dr
- 762 La Mesa Dr
- 59 La Mirada Ct
- 1276 San Angelo Dr
- 717 La Mesa Dr
- 708 La Mesa Dr
- 63 La Mirada Ct
- 55 La Mirada Ct
- 1268 San Angelo Dr
- 1285 La Mirada Dr
- 67 La Mirada Ct
Your Personal Tour Guide
Ask me questions while you tour the home.