Estimated Value: $229,165 - $442,000
3
Beds
2
Baths
1,060
Sq Ft
$292/Sq Ft
Est. Value
About This Home
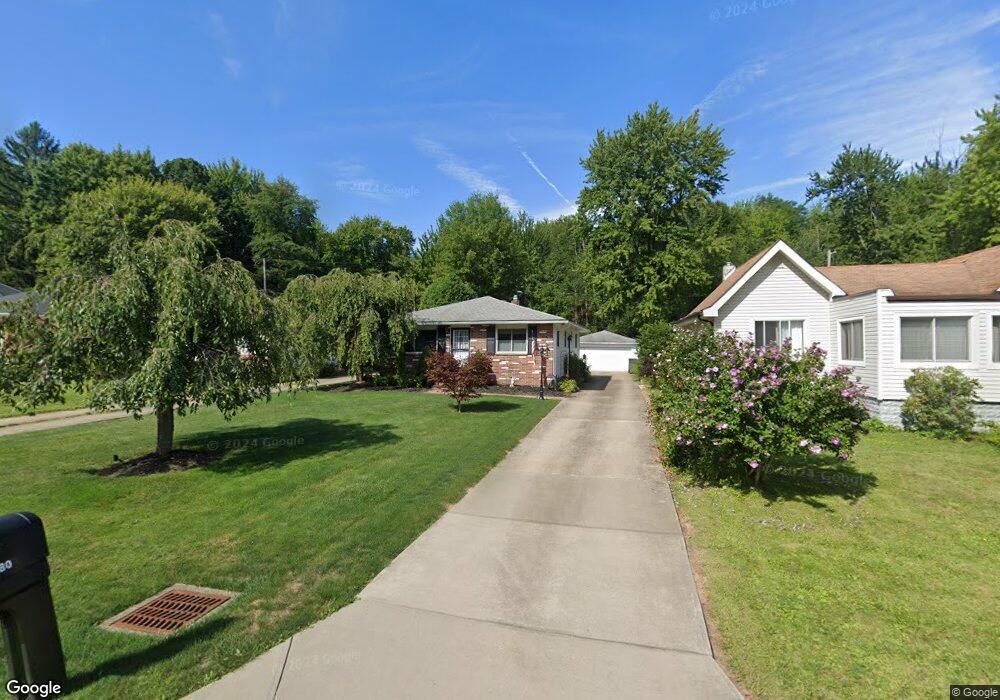
This home is located at 7380 Portage St, Solon, OH 44139 and is currently estimated at $309,041, approximately $291 per square foot. 7380 Portage St is a home located in Cuyahoga County with nearby schools including Orchard Middle School, Solon Middle School, and Solon High School.
Ownership History
Date
Name
Owned For
Owner Type
Purchase Details
Closed on
Sep 30, 2021
Sold by
Bennett Vaughn E and Bennett Vanessa K
Bought by
Bennett Vaughn E
Current Estimated Value
Home Financials for this Owner
Home Financials are based on the most recent Mortgage that was taken out on this home.
Original Mortgage
$156,750
Outstanding Balance
$141,067
Interest Rate
2.8%
Mortgage Type
New Conventional
Estimated Equity
$167,974
Purchase Details
Closed on
Apr 6, 1990
Sold by
Janoski William and Janoski Ethel E
Bought by
Bennett Vaughn E
Purchase Details
Closed on
May 5, 1982
Sold by
Fatica Linda K
Bought by
Janoski William and Janoski Ethel E
Purchase Details
Closed on
Dec 5, 1978
Sold by
Gloria Patricia
Bought by
Fatica Linda K
Purchase Details
Closed on
Jan 1, 1975
Bought by
Gloria Patricia
Create a Home Valuation Report for This Property
The Home Valuation Report is an in-depth analysis detailing your home's value as well as a comparison with similar homes in the area
Home Values in the Area
Average Home Value in this Area
Purchase History
We collect this data history from publicly available records. To have your information removed, we recommend requesting removal directly through your county’s website.
| Date | Buyer | Sale Price | Title Company |
|---|---|---|---|
| Bennett Vaughn E | -- | Amrock Inc | |
| Bennett Vaughn E | $84,000 | -- | |
| Janoski William | $58,000 | -- | |
| Fatica Linda K | $58,000 | -- | |
| Gloria Patricia | -- | -- |
Source: Public Records
Mortgage History
We collect this data history from publicly available records. To have your information removed, we recommend requesting removal directly through your county’s website.
| Date | Status | Borrower | Loan Amount |
|---|---|---|---|
| Open | Bennett Vaughn E | $156,750 |
Source: Public Records
Tax History
| Year | Tax Paid | Tax Assessment Tax Assessment Total Assessment is a certain percentage of the fair market value that is determined by local assessors to be the total taxable value of land and additions on the property. | Land | Improvement |
|---|---|---|---|---|
| 2025 | $4,049 | $66,255 | $4,515 | $61,740 |
| 2024 | $4,049 | $66,255 | $4,515 | $61,740 |
| 2023 | $3,726 | $49,360 | $8,020 | $41,340 |
| 2022 | $3,719 | $49,350 | $8,020 | $41,340 |
| 2021 | $3,681 | $49,350 | $8,020 | $41,340 |
| 2020 | $3,442 | $41,830 | $6,790 | $35,040 |
| 2019 | $3,347 | $119,500 | $19,400 | $100,100 |
| 2018 | $3,150 | $41,830 | $6,790 | $35,040 |
| 2017 | $3,287 | $43,270 | $5,850 | $37,420 |
| 2016 | $3,260 | $43,270 | $5,850 | $37,420 |
| 2015 | $3,146 | $43,270 | $5,850 | $37,420 |
| 2014 | $3,146 | $40,050 | $5,430 | $34,620 |
Source: Public Records
Map
Nearby Homes
- 39600 Aurora Rd
- 0 Willow St Unit 5201131
- 38325 Pettibone Rd
- 10649 Wood Duck Ct
- 10523 Herrington Dr
- 1010 Moneta Ave
- SL Moneta Ave
- 0 Arlington Blvd
- V/L Arlington Blvd
- 1 California (Lot 1) St
- 37174 Tidewater Dr
- 3645 Firethorn Dr
- 10447 Dogwood Dr
- 3784 Firethorn Dr
- 7442 Worlington Dr
- 10411 Redbud Dr
- 7582 Worlington Dr
- 7312 Stockwood Dr
- 36939 Wexford Dr
- 10363 Redbud Dr
- 7384 Portage St
- 7374 Portage St
- 7390 Portage St
- S/L 53 Portage St
- 7394 Portage St
- 7404 Portage St
- 7391 Portage St
- 7360 Portage St
- 7371 Portage St
- 7395 Portage St
- 7410 Portage St
- 7411 Portage St
- 7384 Geauga St
- 7404 Geauga St
- 39560 Aurora Rd
- 39400 Aurora Rd
- 39910 Aurora Rd
- 39450 Aurora Rd
- 7340 Portage St
- 7415 Portage St
Your Personal Tour Guide
Ask me questions while you tour the home.