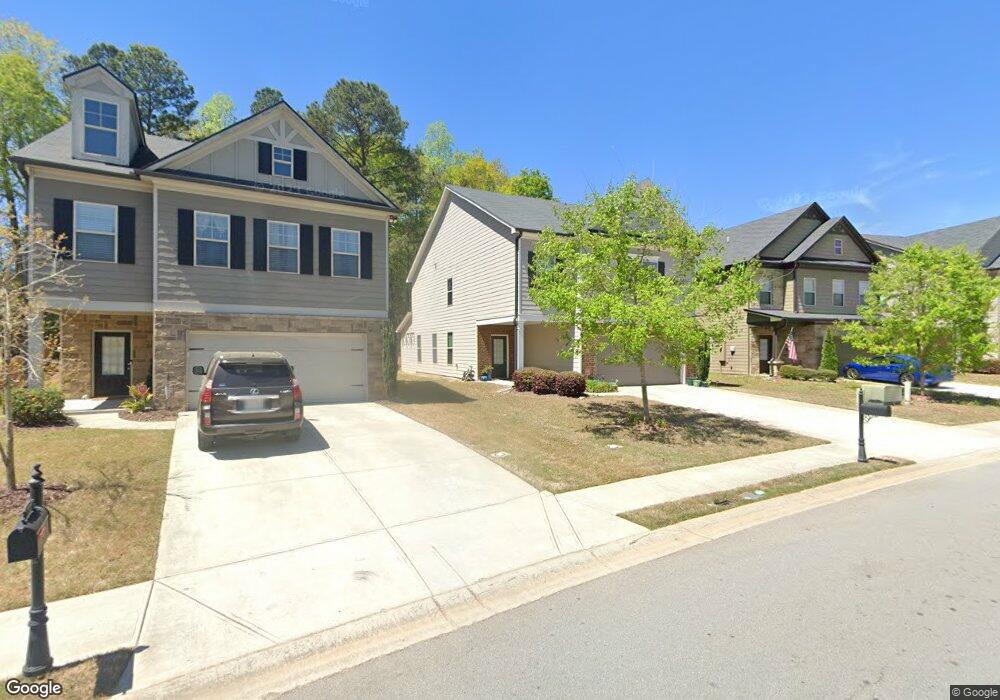
7381 Silk Tree Pointe Braselton, GA 30517
Estimated Value: $389,701 - $425,000
Studio
3
Baths
2,333
Sq Ft
$175/Sq Ft
Est. Value
About This Home
This home is located at 7381 Silk Tree Pointe, Braselton, GA 30517 and is currently estimated at $408,175, approximately $174 per square foot. 7381 Silk Tree Pointe is a home located in Jackson County with nearby schools including West Jackson Elementary School, West Jackson Middle School, and Jackson County High School.
Ownership History
Date
Name
Owned For
Owner Type
Purchase Details
Closed on
Feb 24, 2016
Sold by
Cmh Parks Inc
Bought by
Moore Jason C
Current Estimated Value
Home Financials for this Owner
Home Financials are based on the most recent Mortgage that was taken out on this home.
Original Mortgage
$164,636
Outstanding Balance
$128,779
Interest Rate
3.79%
Mortgage Type
New Conventional
Estimated Equity
$279,396
Purchase Details
Closed on
Oct 2, 2015
Sold by
Chafin Builders Llc
Bought by
Cmh Parks Inc
Purchase Details
Closed on
Mar 26, 2014
Sold by
Res Ga Mulberry Park Llc
Bought by
Chafin Builders Llc
Purchase Details
Closed on
Apr 7, 2012
Sold by
Jackson Land Investors Llc
Bought by
Res Ga Mulberry Park Llc
Purchase Details
Closed on
Apr 3, 2012
Sold by
Liberty Park Development Llc
Bought by
Res-Ga Mulberry Park Llc
Purchase Details
Closed on
May 3, 2011
Sold by
Elrod Donald T Sheriff
Bought by
Adams Roy A
Create a Home Valuation Report for This Property
The Home Valuation Report is an in-depth analysis detailing your home's value as well as a comparison with similar homes in the area
Home Values in the Area
Average Home Value in this Area
Purchase History
| Date | Buyer | Sale Price | Title Company |
|---|---|---|---|
| Moore Jason C | $205,796 | -- | |
| Cmh Parks Inc | -- | -- | |
| Chafin Builders Llc | $22,500 | -- | |
| Res Ga Mulberry Park Llc | -- | -- | |
| Res-Ga Mulberry Park Llc | $4,400 | -- | |
| Adams Roy A | $1,804 | -- |
Source: Public Records
Mortgage History
| Date | Status | Borrower | Loan Amount |
|---|---|---|---|
| Open | Moore Jason C | $164,636 |
Source: Public Records
Tax History
| Year | Tax Paid | Tax Assessment Tax Assessment Total Assessment is a certain percentage of the fair market value that is determined by local assessors to be the total taxable value of land and additions on the property. | Land | Improvement |
|---|---|---|---|---|
| 2025 | $4,384 | $156,240 | $24,800 | $131,440 |
| 2024 | $4,384 | $156,240 | $24,800 | $131,440 |
| 2023 | $4,427 | $140,960 | $24,800 | $116,160 |
| 2022 | $3,750 | $117,040 | $24,800 | $92,240 |
| 2021 | $3,603 | $111,440 | $19,200 | $92,240 |
| 2020 | $3,511 | $99,840 | $19,200 | $80,640 |
| 2019 | $3,439 | $96,080 | $15,440 | $80,640 |
| 2018 | $3,330 | $92,200 | $15,440 | $76,760 |
| 2017 | $2,996 | $82,914 | $15,440 | $67,474 |
| 2016 | $2,088 | $57,152 | $15,440 | $41,712 |
| 2015 | $330 | $10,000 | $10,000 | $0 |
| 2014 | $360 | $10,000 | $10,000 | $0 |
| 2013 | -- | $1,920 | $1,920 | $0 |
Source: Public Records
Map
Nearby Homes
- 7281 Silk Tree Pointe
- 9036 Lexington Ct
- 9628 Rushmore Cir
- 7260 Silk Tree Pointe
- 3247 Hawthorne Path
- 3244 Hawthorne Path
- 7671 Silk Tree Pointe
- 7671 Silk Tree
- 7700 Silk Tree Pointe
- 3124 Hawthorne Path
- 2560 Olney Falls Dr
- 2545 Olney Falls Dr
- 799 Gold Crest Dr
- 799 Gold Crest Rd
- 1822 Madrid Falls Dr
- 6854 White Walnut Way
- 186 Catalpa Grove
- 6495 Whitebeam Trail
- 6422 Mossy Oak Landing
- 6420 Mossy Oak Landing
- 7381 Silk Tree Pointe
- 7381 Silk Tree Pointe
- 7391 Silk Tree Pte
- 7391 Silk Tree Pointe
- 7371 Silk Tree Pointe
- 7371 Silk Tree Pte
- 7391 Silk Tree Pointe
- 7371 Silk Tree Pointe
- 7401 Silk Tree Pointe
- 7401 Silk Tree Pte
- 7361 Silk Tree Pointe
- 7361 Silk Tree Pte
- 7401 Silk Tree Pointe
- 7361 Silk Tree Pointe
- 7411 Silk Tree Pointe
- 7411 Silk Tree Pointe
- 7380 Silk Tree Pointe
- 7380 Silk Tree Pte
- 7411 Silk Tree Pointe
- 7390 Silk Tree Pointe
Your Personal Tour Guide
Ask me questions while you tour the home.