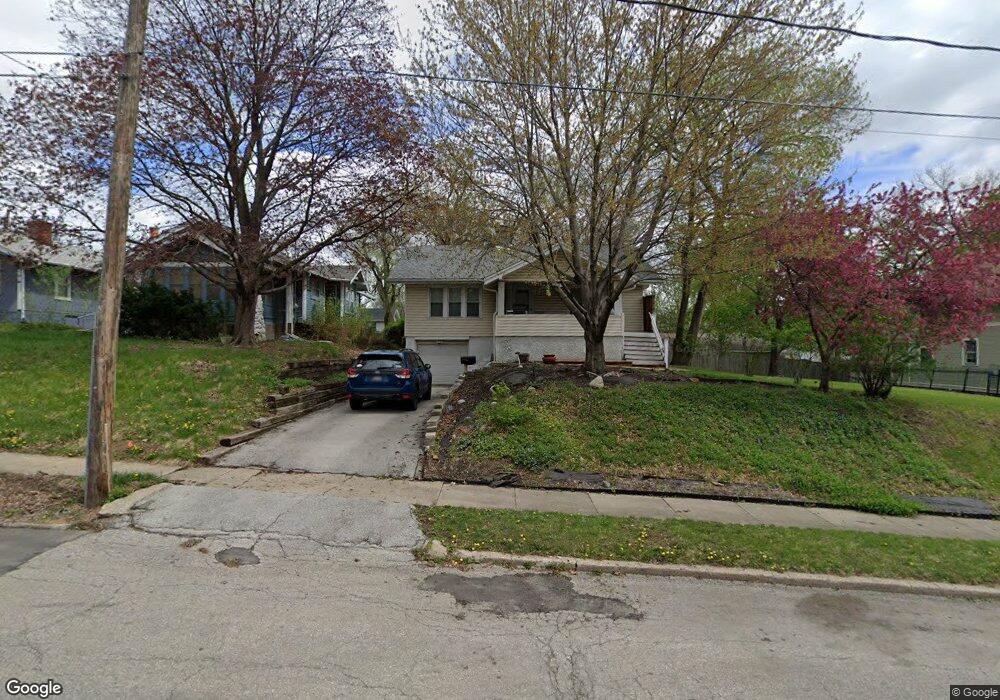
739 39th St Des Moines, IA 50312
North of Grand NeighborhoodEstimated Value: $190,004 - $216,000
2
Beds
1
Bath
1,088
Sq Ft
$185/Sq Ft
Est. Value
About This Home
This home is located at 739 39th St, Des Moines, IA 50312 and is currently estimated at $201,501, approximately $185 per square foot. 739 39th St is a home located in Polk County with nearby schools including Hubbell Elementary, Roosevelt High School, and Bergman Academy.
Ownership History
Date
Name
Owned For
Owner Type
Purchase Details
Closed on
Apr 11, 2016
Sold by
Bates Dennis L and Bates Sally D
Bought by
Bates Jeremy M
Current Estimated Value
Purchase Details
Closed on
Aug 27, 2004
Sold by
Bates Dennis L and Bates Sally D
Bought by
Bates Dennis L and Bates Sally D
Purchase Details
Closed on
Jul 29, 2004
Sold by
Phillips Cleta M
Bought by
Bates Dennis L and Bates Sally D
Purchase Details
Closed on
Jan 8, 1998
Sold by
Phillips Buford L and Phillips Cleta M
Bought by
Phillips Buford L and Phillips Cleta M
Create a Home Valuation Report for This Property
The Home Valuation Report is an in-depth analysis detailing your home's value as well as a comparison with similar homes in the area
Home Values in the Area
Average Home Value in this Area
Purchase History
| Date | Buyer | Sale Price | Title Company |
|---|---|---|---|
| Bates Jeremy M | -- | None Available | |
| Bates Dennis L | -- | -- | |
| Bates Dennis L | -- | -- | |
| Phillips Buford L | -- | -- |
Source: Public Records
Tax History Compared to Growth
Tax History
| Year | Tax Paid | Tax Assessment Tax Assessment Total Assessment is a certain percentage of the fair market value that is determined by local assessors to be the total taxable value of land and additions on the property. | Land | Improvement |
|---|---|---|---|---|
| 2025 | $3,088 | $187,200 | $37,600 | $149,600 |
| 2024 | $3,088 | $167,400 | $33,400 | $134,000 |
| 2023 | $3,430 | $167,400 | $33,400 | $134,000 |
| 2022 | $3,402 | $154,400 | $31,700 | $122,700 |
| 2021 | $3,292 | $154,400 | $31,700 | $122,700 |
| 2020 | $3,414 | $140,500 | $28,900 | $111,600 |
| 2019 | $3,050 | $140,500 | $28,900 | $111,600 |
| 2018 | $3,014 | $122,000 | $25,000 | $97,000 |
| 2017 | $2,694 | $122,000 | $25,000 | $97,000 |
| 2016 | $2,618 | $108,100 | $22,000 | $86,100 |
| 2015 | $2,618 | $108,100 | $22,000 | $86,100 |
| 2014 | $2,490 | $102,400 | $20,800 | $81,600 |
Source: Public Records
Map
Nearby Homes