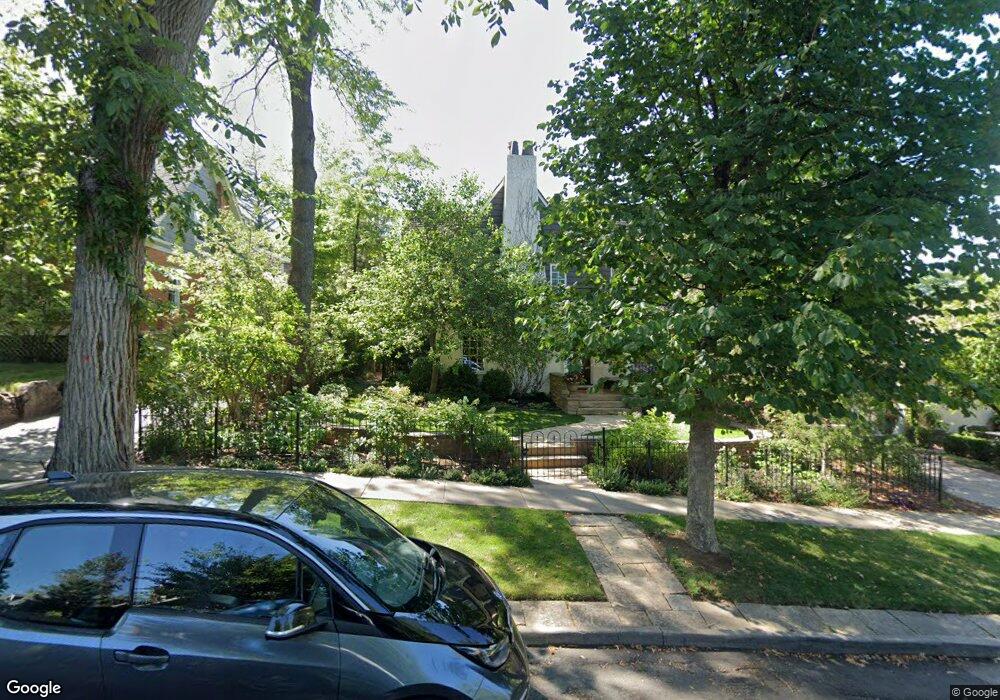
739 Grant Place Boulder, CO 80302
University Hill NeighborhoodEstimated Value: $2,341,789 - $2,966,000
3
Beds
4
Baths
3,277
Sq Ft
$833/Sq Ft
Est. Value
About This Home
This home is located at 739 Grant Place, Boulder, CO 80302 and is currently estimated at $2,730,197, approximately $833 per square foot. 739 Grant Place is a home located in Boulder County with nearby schools including Flatirons Elementary School, Manhattan Middle School of the Arts & Academics, and Boulder High School.
Ownership History
Date
Name
Owned For
Owner Type
Purchase Details
Closed on
Nov 26, 2024
Sold by
Oneil Elizabeth Joann
Bought by
Elizabeth J Oneil Revocable Trust
Current Estimated Value
Purchase Details
Closed on
Feb 6, 2017
Sold by
Oneil David G
Bought by
Oneil Elizabeth Joarun
Purchase Details
Closed on
Sep 21, 1992
Bought by
Oneil Elizabeth Joann
Purchase Details
Closed on
Jun 6, 1990
Bought by
Oneil Elizabeth Joann
Purchase Details
Closed on
Dec 7, 1987
Bought by
Oneil Elizabeth Joann
Purchase Details
Closed on
Sep 24, 1985
Bought by
Oneil Elizabeth Joann
Create a Home Valuation Report for This Property
The Home Valuation Report is an in-depth analysis detailing your home's value as well as a comparison with similar homes in the area
Home Values in the Area
Average Home Value in this Area
Purchase History
| Date | Buyer | Sale Price | Title Company |
|---|---|---|---|
| Elizabeth J Oneil Revocable Trust | -- | None Listed On Document | |
| Elizabeth J Oneil Revocable Trust | -- | None Listed On Document | |
| Oneil Elizabeth Joarun | -- | None Available | |
| Oneil Elizabeth Joann | -- | -- | |
| Oneil Elizabeth Joann | $175,000 | -- | |
| Oneil Elizabeth Joann | $150,000 | -- | |
| Oneil Elizabeth Joann | $135,800 | -- |
Source: Public Records
Tax History
| Year | Tax Paid | Tax Assessment Tax Assessment Total Assessment is a certain percentage of the fair market value that is determined by local assessors to be the total taxable value of land and additions on the property. | Land | Improvement |
|---|---|---|---|---|
| 2025 | $15,350 | $166,938 | $87,544 | $79,394 |
| 2024 | $15,350 | $166,938 | $87,544 | $79,394 |
| 2023 | $15,084 | $174,662 | $90,316 | $88,031 |
| 2022 | $13,325 | $143,490 | $76,200 | $67,290 |
| 2021 | $12,706 | $147,619 | $78,393 | $69,226 |
| 2020 | $11,869 | $136,351 | $74,074 | $62,277 |
| 2019 | $11,687 | $136,351 | $74,074 | $62,277 |
| 2018 | $10,332 | $119,174 | $47,664 | $71,510 |
| 2017 | $10,009 | $131,754 | $52,695 | $79,059 |
| 2016 | $9,008 | $104,061 | $41,631 | $62,430 |
| 2015 | $8,530 | $98,004 | $53,332 | $44,672 |
| 2014 | $8,240 | $98,004 | $53,332 | $44,672 |
Source: Public Records
Map
Nearby Homes
- 751 Grant Place
- 800 Grant Place
- 611 Cascade Ave Unit 7
- 820 6th St
- 911 Lincoln Place
- 440 Christmas Tree Dr
- 964 Grant Place
- 770 Circle Dr
- 650 12th St
- 1021 9th St
- 839 13th St
- 333 Bellevue Dr
- 715 14th St
- 780 College Ave
- 851 14th St
- 1333 Mariposa Ave
- 505 Geneva Ave
- 789 15th St
- 1128 Lincoln Place
- 255 Bellevue Dr
Your Personal Tour Guide
Ask me questions while you tour the home.