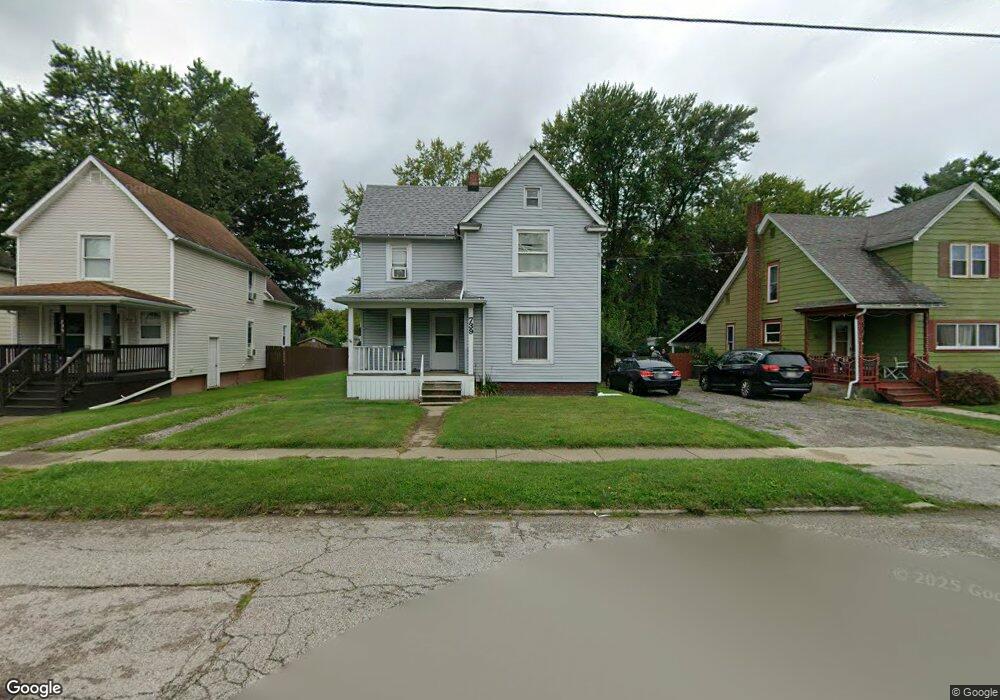
739 Harbor St Conneaut, OH 44030
Estimated Value: $88,000 - $108,719
3
Beds
2
Baths
1,284
Sq Ft
$74/Sq Ft
Est. Value
About This Home
This home is located at 739 Harbor St, Conneaut, OH 44030 and is currently estimated at $95,180, approximately $74 per square foot. 739 Harbor St is a home located in Ashtabula County with nearby schools including Lakeshore Primary Elementary School, Gateway Elementary School, and Conneaut Middle School.
Ownership History
Date
Name
Owned For
Owner Type
Purchase Details
Closed on
Aug 4, 2009
Sold by
Pnc Bank Na
Bought by
Shermans Rentals Llc
Current Estimated Value
Purchase Details
Closed on
Jul 21, 2009
Sold by
Smith Karen L and Smith Adrian W
Bought by
Pnc Bank Na
Purchase Details
Closed on
May 2, 2007
Sold by
Deerfield Construction Group Llc
Bought by
Smith Adrian W and Smith Karen L
Purchase Details
Closed on
Feb 7, 2007
Sold by
Jpmorgan Chase Bank
Bought by
Deerfield Construction Llc
Purchase Details
Closed on
Jan 26, 2006
Sold by
Dinger Allan J and Dinger Shannon L
Bought by
Jp Morgan Chase Bank and Equity One Abs Inc Mortgage Pass Through
Create a Home Valuation Report for This Property
The Home Valuation Report is an in-depth analysis detailing your home's value as well as a comparison with similar homes in the area
Home Values in the Area
Average Home Value in this Area
Purchase History
| Date | Buyer | Sale Price | Title Company |
|---|---|---|---|
| Shermans Rentals Llc | $21,000 | Attorney | |
| Pnc Bank Na | $36,000 | None Available | |
| Smith Adrian W | -- | Venture Land Title Agency | |
| Deerfield Construction Llc | $29,200 | Landamerica Lawyers Title | |
| Jp Morgan Chase Bank | $38,000 | None Available |
Source: Public Records
Tax History
| Year | Tax Paid | Tax Assessment Tax Assessment Total Assessment is a certain percentage of the fair market value that is determined by local assessors to be the total taxable value of land and additions on the property. | Land | Improvement |
|---|---|---|---|---|
| 2024 | $1,716 | $23,460 | $3,750 | $19,710 |
| 2023 | $1,113 | $23,460 | $3,750 | $19,710 |
| 2022 | $974 | $18,070 | $2,910 | $15,160 |
| 2021 | $991 | $18,070 | $2,910 | $15,160 |
| 2020 | $990 | $18,070 | $2,910 | $15,160 |
| 2019 | $795 | $14,210 | $1,610 | $12,600 |
| 2018 | $759 | $14,210 | $1,610 | $12,600 |
| 2017 | $789 | $14,210 | $1,610 | $12,600 |
| 2016 | $813 | $16,630 | $1,890 | $14,740 |
| 2015 | $821 | $16,630 | $1,890 | $14,740 |
| 2014 | $727 | $16,630 | $1,890 | $14,740 |
| 2013 | $569 | $13,370 | $2,380 | $10,990 |
Source: Public Records
Map
Nearby Homes
- 169 River St
- 992 Mill St
- 716 Chestnut St
- 555 Wrights Ave
- 375 Bliss Ave
- 450 Buffalo St
- 386 Washington St
- 146 Nickle Plate Ave
- 284 Clay St
- 474 Sherman St
- 536 Madison St
- 475 State St
- 404 Viaduct St
- 681 Madison St
- 166 Welton Rd
- 745 Maple Ave
- 238 Whitney St
- 434 E Main Rd
- 855 Spring St Unit S9
- 18 Hillcrest Ct
- 745 Harbor St
- 731 Harbor St
- 735 Harbor St
- 749 Harbor St
- 729 Harbor St
- 220 Russell St
- 770 Broad St
- 774 Broad St
- 778 Broad St
- 0 Broad State Rd 7 St Unit 5029826
- 0 Broad State Rd 7 St Unit 4422960
- 758 Broad St
- 746 Harbor St
- 719 Harbor St
- 786 Broad St
- 732 Harbor St
- 215 Russell St
- 754 Harbor St
- 728 Harbor St
- 726 Harbor St
Your Personal Tour Guide
Ask me questions while you tour the home.