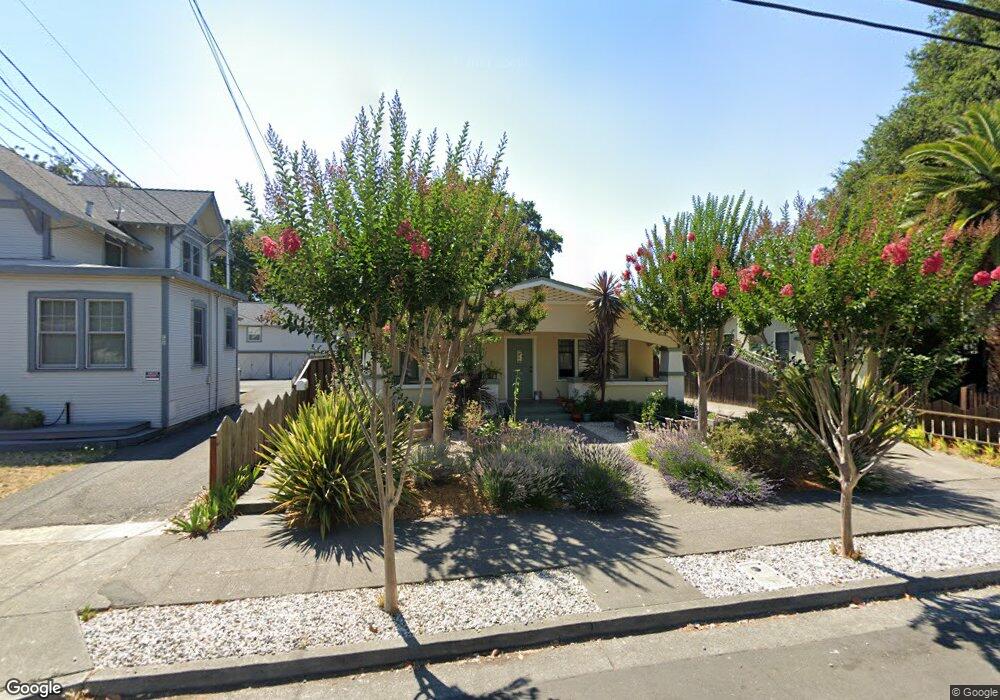
739 Humboldt St Santa Rosa, CA 95404
Junior College NeighborhoodEstimated Value: $545,000 - $793,000
2
Beds
1
Bath
1,594
Sq Ft
$436/Sq Ft
Est. Value
About This Home
This home is located at 739 Humboldt St, Santa Rosa, CA 95404 and is currently estimated at $695,203, approximately $436 per square foot. 739 Humboldt St is a home located in Sonoma County with nearby schools including Steele Lane Elementary School, Santa Rosa Middle School, and Santa Rosa High School.
Ownership History
Date
Name
Owned For
Owner Type
Purchase Details
Closed on
May 10, 2013
Sold by
Hutchinson Richard M and Porrino Ann Hutchinson
Bought by
Hegarty Elizabeth L and Hegarty Galen P
Current Estimated Value
Home Financials for this Owner
Home Financials are based on the most recent Mortgage that was taken out on this home.
Original Mortgage
$314,800
Outstanding Balance
$223,270
Interest Rate
3.5%
Mortgage Type
New Conventional
Estimated Equity
$471,933
Create a Home Valuation Report for This Property
The Home Valuation Report is an in-depth analysis detailing your home's value as well as a comparison with similar homes in the area
Home Values in the Area
Average Home Value in this Area
Purchase History
| Date | Buyer | Sale Price | Title Company |
|---|---|---|---|
| Hegarty Elizabeth L | $420,000 | First American Title Company |
Source: Public Records
Mortgage History
| Date | Status | Borrower | Loan Amount |
|---|---|---|---|
| Open | Hegarty Elizabeth L | $314,800 |
Source: Public Records
Tax History Compared to Growth
Tax History
| Year | Tax Paid | Tax Assessment Tax Assessment Total Assessment is a certain percentage of the fair market value that is determined by local assessors to be the total taxable value of land and additions on the property. | Land | Improvement |
|---|---|---|---|---|
| 2025 | $5,857 | $516,879 | $215,493 | $301,386 |
| 2024 | $5,857 | $506,745 | $211,268 | $295,477 |
| 2023 | $5,857 | $496,810 | $207,126 | $289,684 |
| 2022 | $5,411 | $487,069 | $203,065 | $284,004 |
| 2021 | $5,345 | $477,520 | $199,084 | $278,436 |
| 2020 | $5,402 | $472,624 | $197,043 | $275,581 |
| 2019 | $5,306 | $463,358 | $193,180 | $270,178 |
| 2018 | $5,277 | $454,274 | $189,393 | $264,881 |
| 2017 | $5,183 | $445,368 | $185,680 | $259,688 |
| 2016 | $5,146 | $436,637 | $182,040 | $254,597 |
| 2015 | $4,991 | $430,079 | $179,306 | $250,773 |
| 2014 | $4,687 | $421,655 | $175,794 | $245,861 |
Source: Public Records
Map
Nearby Homes