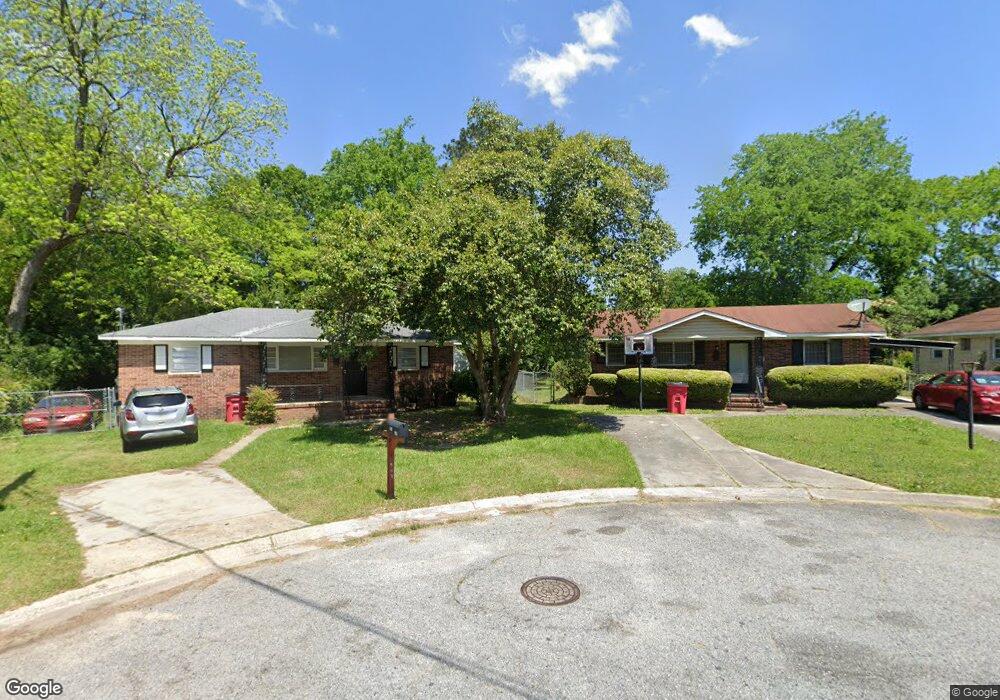
739 Key Ct Macon, GA 31204
Estimated Value: $66,000 - $82,803
2
Beds
1
Bath
1,025
Sq Ft
$70/Sq Ft
Est. Value
About This Home
This home is located at 739 Key Ct, Macon, GA 31204 and is currently estimated at $71,951, approximately $70 per square foot. 739 Key Ct is a home located in Bibb County with nearby schools including Hartley Elementary School, Southwest High School, and Cirrus Charter Academy.
Ownership History
Date
Name
Owned For
Owner Type
Purchase Details
Closed on
Feb 20, 2020
Sold by
Mq Properties Llc
Bought by
Chikofte Llc
Current Estimated Value
Purchase Details
Closed on
Jan 17, 2020
Sold by
The Max Properties Llc
Bought by
Mq Properties Llc
Purchase Details
Closed on
Oct 16, 2006
Sold by
Wells Fargo Bank
Bought by
Oliver David P
Purchase Details
Closed on
Jul 5, 2006
Purchase Details
Closed on
Nov 28, 2005
Sold by
Rutland Evelyn Dean
Bought by
Cole Antonio D
Home Financials for this Owner
Home Financials are based on the most recent Mortgage that was taken out on this home.
Original Mortgage
$36,000
Interest Rate
6.04%
Mortgage Type
New Conventional
Create a Home Valuation Report for This Property
The Home Valuation Report is an in-depth analysis detailing your home's value as well as a comparison with similar homes in the area
Home Values in the Area
Average Home Value in this Area
Purchase History
| Date | Buyer | Sale Price | Title Company |
|---|---|---|---|
| Chikofte Llc | $108,873 | None Available | |
| Mq Properties Llc | $1,160,000 | None Available | |
| Oliver David P | $32,000 | -- | |
| -- | $38,900 | -- | |
| Wells Fargo Bank | $38,930 | None Available | |
| Cole Antonio D | $36,000 | None Available |
Source: Public Records
Mortgage History
| Date | Status | Borrower | Loan Amount |
|---|---|---|---|
| Previous Owner | Cole Antonio D | $36,000 |
Source: Public Records
Tax History Compared to Growth
Tax History
| Year | Tax Paid | Tax Assessment Tax Assessment Total Assessment is a certain percentage of the fair market value that is determined by local assessors to be the total taxable value of land and additions on the property. | Land | Improvement |
|---|---|---|---|---|
| 2025 | $458 | $18,622 | $2,755 | $15,867 |
| 2024 | $466 | $18,357 | $2,755 | $15,602 |
| 2023 | $384 | $15,122 | $1,900 | $13,222 |
| 2022 | $390 | $11,257 | $2,339 | $8,918 |
| 2021 | $408 | $10,733 | $2,339 | $8,394 |
| 2020 | $323 | $8,331 | $1,871 | $6,460 |
| 2019 | $326 | $8,331 | $1,871 | $6,460 |
| 2018 | $679 | $8,331 | $1,871 | $6,460 |
| 2017 | $312 | $8,331 | $1,871 | $6,460 |
| 2016 | $294 | $8,507 | $2,807 | $5,700 |
| 2015 | $417 | $8,507 | $2,807 | $5,700 |
| 2014 | $518 | $9,199 | $3,119 | $6,080 |
Source: Public Records
Map
Nearby Homes
- 736 Key St
- 646 Straight St
- 800 Patton Ave
- 808 Patton Ave
- 815 Edwards Ave
- 1553 Florence Ave
- 1556 Wellworth Ave
- 742 Grayson Ave
- 1567 Wellworth Ave
- 755 Grosso Ave
- 1559 Wellworth Ave
- 777 Grosso Ave
- 1511 Berkner Ave
- 1516 Berkner Ave
- 284 Grosso Ave
- 1545 Wellworth Ave
- 1638 Burton Ave
- 3758 Mercer University Dr