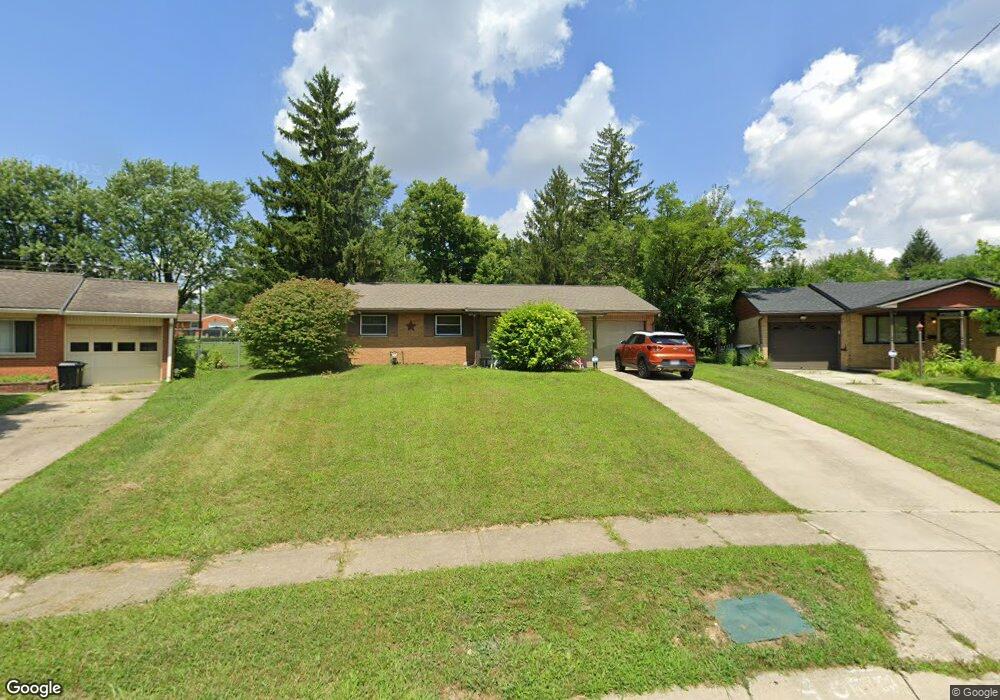
739 Loop St Miamisburg, OH 45342
Downtown Miamisburg NeighborhoodEstimated Value: $175,000 - $215,125
3
Beds
2
Baths
1,171
Sq Ft
$168/Sq Ft
Est. Value
About This Home
This home is located at 739 Loop St, Miamisburg, OH 45342 and is currently estimated at $197,031, approximately $168 per square foot. 739 Loop St is a home located in Montgomery County with nearby schools including Miamisburg High School and Bethel Baptist School.
Ownership History
Date
Name
Owned For
Owner Type
Purchase Details
Closed on
Oct 22, 2015
Sold by
Burchfield Sheryl D
Bought by
Faulkner Joshua D and Faulkner Shiri M
Current Estimated Value
Home Financials for this Owner
Home Financials are based on the most recent Mortgage that was taken out on this home.
Original Mortgage
$82,478
Outstanding Balance
$65,715
Interest Rate
4.5%
Mortgage Type
FHA
Estimated Equity
$131,316
Purchase Details
Closed on
Jun 24, 2008
Sold by
Burchfield Sheryl D and Burchfield Scott E
Bought by
Burchfield Scott E and Burchfield Sheryl D
Purchase Details
Closed on
May 30, 2002
Sold by
Randoll Colwell
Bought by
Burchfield Sheryl D and Burchfield Scott E
Home Financials for this Owner
Home Financials are based on the most recent Mortgage that was taken out on this home.
Original Mortgage
$81,900
Interest Rate
10.9%
Create a Home Valuation Report for This Property
The Home Valuation Report is an in-depth analysis detailing your home's value as well as a comparison with similar homes in the area
Home Values in the Area
Average Home Value in this Area
Purchase History
| Date | Buyer | Sale Price | Title Company |
|---|---|---|---|
| Faulkner Joshua D | $84,000 | Chicago Title Agency Llc | |
| Burchfield Scott E | -- | Attorney | |
| Burchfield Sheryl D | $82,000 | -- |
Source: Public Records
Mortgage History
| Date | Status | Borrower | Loan Amount |
|---|---|---|---|
| Open | Faulkner Joshua D | $82,478 | |
| Previous Owner | Burchfield Sheryl D | $81,900 |
Source: Public Records
Tax History
| Year | Tax Paid | Tax Assessment Tax Assessment Total Assessment is a certain percentage of the fair market value that is determined by local assessors to be the total taxable value of land and additions on the property. | Land | Improvement |
|---|---|---|---|---|
| 2025 | $3,403 | $52,190 | $10,430 | $41,760 |
| 2024 | $3,318 | $52,190 | $10,430 | $41,760 |
| 2023 | $3,318 | $52,190 | $10,430 | $41,760 |
| 2022 | $2,647 | $35,030 | $7,000 | $28,030 |
| 2021 | $2,342 | $35,030 | $7,000 | $28,030 |
| 2020 | $2,336 | $35,030 | $7,000 | $28,030 |
| 2019 | $2,177 | $29,930 | $7,000 | $22,930 |
| 2018 | $2,184 | $29,930 | $7,000 | $22,930 |
| 2017 | $2,169 | $29,930 | $7,000 | $22,930 |
| 2016 | $1,924 | $25,550 | $7,000 | $18,550 |
| 2015 | $2,103 | $25,550 | $7,000 | $18,550 |
| 2014 | $2,103 | $25,550 | $7,000 | $18,550 |
| 2012 | -- | $33,140 | $10,780 | $22,360 |
Source: Public Records
Map
Nearby Homes
- 1205 Kercher St
- 1103 Kercher St
- 1020 N 11th St
- 504 Nancy Dr
- 1102 N Heincke Rd
- 638 Sennett St
- 1410 Orchard Hill Dr
- 722 Little John Ct
- 740 E Central Ave
- 545 Buckeye St
- 1660 E Central Ave
- 736 Park Ave
- 631 Wilson Park Dr
- 1845 S Bayberry Dr
- 2110 Sir Lockesley Dr
- 402 Wilson Park Dr
- 1839 E Lindsey Ave
- 304 N 4th St
- 312 Applehill Dr
- 847 Stout Will Ct
Your Personal Tour Guide
Ask me questions while you tour the home.