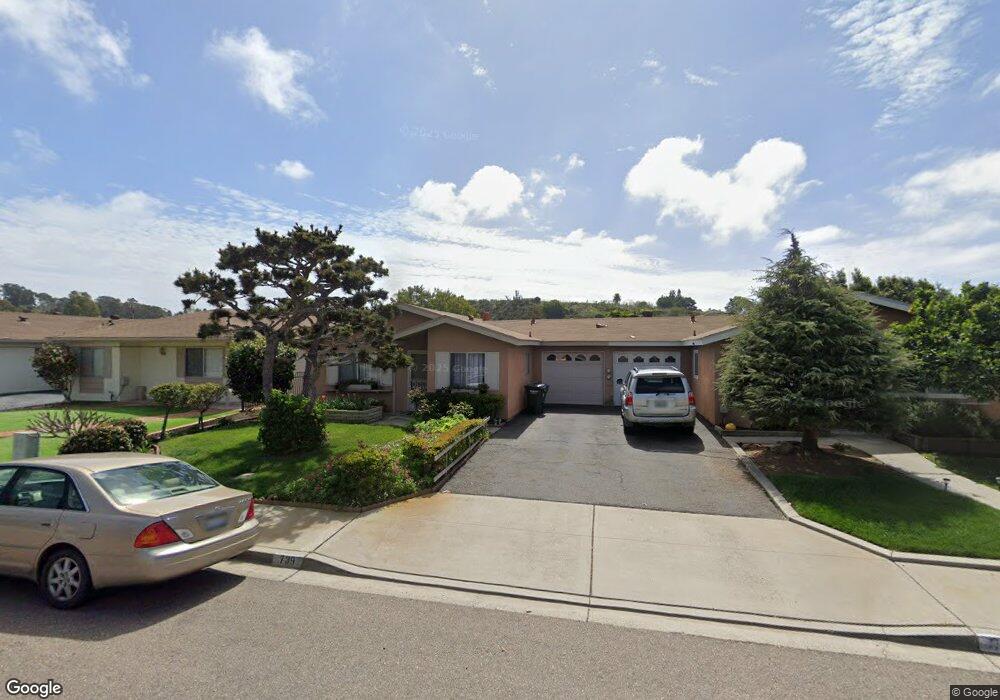
739 Snapdragon St Encinitas, CA 92024
Central Encinitas NeighborhoodEstimated Value: $781,095 - $1,169,000
2
Beds
1
Bath
827
Sq Ft
$1,219/Sq Ft
Est. Value
About This Home
This home is located at 739 Snapdragon St, Encinitas, CA 92024 and is currently estimated at $1,008,524, approximately $1,219 per square foot. 739 Snapdragon St is a home located in San Diego County with nearby schools including Park Dale Lane Elementary, Oak Crest Middle School, and La Costa Canyon High School.
Ownership History
Date
Name
Owned For
Owner Type
Purchase Details
Closed on
Jul 20, 2021
Sold by
Hoppe Mark Anthony and Hoppe Thomas
Bought by
Padus Michae and Padus Thomas
Current Estimated Value
Purchase Details
Closed on
Feb 21, 2012
Sold by
Blinco Thomas A and Blinco Lila C
Bought by
Hoppe Mark Anthony
Purchase Details
Closed on
Oct 26, 2001
Sold by
Blinco Thomas A and Blinco Lila C
Bought by
Blinco Thomas A and Blinco Lila C
Purchase Details
Closed on
Apr 22, 1991
Create a Home Valuation Report for This Property
The Home Valuation Report is an in-depth analysis detailing your home's value as well as a comparison with similar homes in the area
Home Values in the Area
Average Home Value in this Area
Purchase History
| Date | Buyer | Sale Price | Title Company |
|---|---|---|---|
| Padus Michae | -- | None Available | |
| Hoppe Mark Anthony | -- | None Available | |
| Blinco Thomas A | -- | -- | |
| Blinco Thomas A | -- | -- | |
| -- | $137,600 | -- |
Source: Public Records
Tax History
| Year | Tax Paid | Tax Assessment Tax Assessment Total Assessment is a certain percentage of the fair market value that is determined by local assessors to be the total taxable value of land and additions on the property. | Land | Improvement |
|---|---|---|---|---|
| 2025 | $2,238 | $173,214 | $43,785 | $129,429 |
| 2024 | $2,238 | $169,819 | $42,927 | $126,892 |
| 2023 | $2,126 | $166,490 | $42,086 | $124,404 |
| 2022 | $2,011 | $163,226 | $41,261 | $121,965 |
| 2021 | $1,979 | $160,026 | $40,452 | $119,574 |
| 2020 | $2,084 | $158,386 | $40,038 | $118,348 |
| 2019 | $2,049 | $155,281 | $39,253 | $116,028 |
| 2018 | $2,025 | $152,237 | $38,484 | $113,753 |
| 2017 | $191 | $149,253 | $37,730 | $111,523 |
| 2016 | $1,977 | $146,328 | $36,991 | $109,337 |
| 2015 | $1,934 | $144,131 | $36,436 | $107,695 |
| 2014 | $1,893 | $141,309 | $35,723 | $105,586 |
Source: Public Records
Map
Nearby Homes
- 731 Teaberry St Unit 4
- 800 Encinitas Blvd Unit 104
- 155 Rosebay Dr Unit 42
- 271 Coneflower St
- 548 Quail Pointe Ln
- 935 Encinitas Blvd
- 664 Sea Ridge Ct
- 598 Paloma Ct
- 634 Shasta Dr
- 760 Bonita Dr
- 103 Mangano Cir
- 623 Quail Gardens Ln
- 407 Requeza St Unit E9
- 444 N El Camino Real Unit 47
- 444 N El Camino Real Unit 48
- 444 N El Camino Real Unit SPC 42
- 444 N El Camino Real Unit 119
- 444 N El Camino Real Unit 23
- 444 N El Camino Real Unit 110
- 350 N El Camino Real Unit 78s
- 737 Snapdragon St
- 743 Snapdragon St
- 745 Snapdragon St
- 731 Snapdragon St
- 733 Snapdragon St
- 736 Teaberry St
- 738 Teaberry St
- 742 Teaberry St
- 744 Teaberry St
- 730 Teaberry St
- 732 Teaberry St
- 751 Snapdragon St
- 749 Snapdragon St
- 736 Snapdragon St
- 738 Snapdragon St
- 744 Snapdragon St
- 748 Teaberry St
- 750 Teaberry St
- 730 Snapdragon St
- 732 Snapdragon St
Your Personal Tour Guide
Ask me questions while you tour the home.