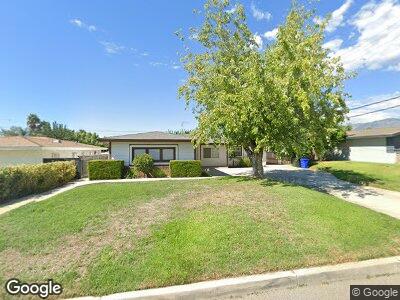
7396 Via Paraiso Rancho Cucamonga, CA 91730
Red Hill NeighborhoodEstimated Value: $664,809 - $764,000
4
Beds
2
Baths
1,284
Sq Ft
$571/Sq Ft
Est. Value
About This Home
This home is located at 7396 Via Paraiso, Rancho Cucamonga, CA 91730 and is currently estimated at $733,202, approximately $571 per square foot. 7396 Via Paraiso is a home located in San Bernardino County with nearby schools including Valle Vista Elementary, Cucamonga Middle, and Alta Loma High.
Ownership History
Date
Name
Owned For
Owner Type
Purchase Details
Closed on
Feb 6, 2013
Sold by
Wilson Johnathan E
Bought by
Wilson Jonathan E and Wilson Irma E
Current Estimated Value
Home Financials for this Owner
Home Financials are based on the most recent Mortgage that was taken out on this home.
Original Mortgage
$156,700
Interest Rate
3.32%
Mortgage Type
New Conventional
Purchase Details
Closed on
Sep 12, 2012
Sold by
Wilson Johnathan
Bought by
Wilson Johnathan E and Wilson Irma E
Purchase Details
Closed on
Oct 19, 2006
Sold by
Wilson Johnathan
Bought by
Wilson Johnathan and Wilson Irma E
Purchase Details
Closed on
Nov 21, 2002
Sold by
Wilson Irma E
Bought by
Wilson Johnathan
Home Financials for this Owner
Home Financials are based on the most recent Mortgage that was taken out on this home.
Original Mortgage
$75,000
Interest Rate
6.28%
Mortgage Type
Unknown
Create a Home Valuation Report for This Property
The Home Valuation Report is an in-depth analysis detailing your home's value as well as a comparison with similar homes in the area
Home Values in the Area
Average Home Value in this Area
Purchase History
| Date | Buyer | Sale Price | Title Company |
|---|---|---|---|
| Wilson Jonathan E | -- | Accommodation | |
| Wilson Johnathan E | -- | First American Title Company | |
| Wilson Johnathan E | -- | None Available | |
| Wilson Johnathan | -- | Accommodation | |
| Wilson Johnathan | -- | Stewart Title Company |
Source: Public Records
Mortgage History
| Date | Status | Borrower | Loan Amount |
|---|---|---|---|
| Closed | Wilson Johnathan E | $156,700 | |
| Closed | Wilson Johnathan | $168,000 | |
| Closed | Wilson Johnathan | $75,000 |
Source: Public Records
Tax History Compared to Growth
Tax History
| Year | Tax Paid | Tax Assessment Tax Assessment Total Assessment is a certain percentage of the fair market value that is determined by local assessors to be the total taxable value of land and additions on the property. | Land | Improvement |
|---|---|---|---|---|
| 2024 | $1,801 | $159,319 | $35,847 | $123,472 |
| 2023 | $1,762 | $156,195 | $35,144 | $121,051 |
| 2022 | $1,735 | $153,132 | $34,455 | $118,677 |
| 2021 | $1,734 | $150,129 | $33,779 | $116,350 |
| 2020 | $1,686 | $148,590 | $33,433 | $115,157 |
| 2019 | $1,678 | $145,676 | $32,777 | $112,899 |
| 2018 | $1,631 | $142,819 | $32,134 | $110,685 |
| 2017 | $1,603 | $140,019 | $31,504 | $108,515 |
| 2016 | $1,584 | $137,273 | $30,886 | $106,387 |
| 2015 | $1,567 | $135,211 | $30,422 | $104,789 |
| 2014 | $1,523 | $132,562 | $29,826 | $102,736 |
Source: Public Records
Map
Nearby Homes
- 7563 Alta Cuesta Dr
- 7586 Cerrito Rojo Dr
- 8641 La Grande St
- 8535 La Vine St
- 1526 Cole Ln
- 8672 La Grande St
- 1444 Upland Hills Dr N Unit 226
- 7822 Alta Cuesta Dr
- 7759 Calle Bresca
- 1314 N North Hills Dr
- 7544 Zircon Ave
- 1461 E 14th St
- 0 Camino Predera Unit WS25061987
- 0 Camino Predera Unit OC25052443
- 8784 Lurline St
- 1268 Upland Hills Dr S
- 6880 Topaz St
- 8631 Holly St
- 1432 Felicita Ct
- 1244 Winged Foot Dr Unit 24
- 7396 Via Paraiso
- 7406 Via Paraiso
- 7405 Via Salsipuedes
- 8407 Via Airosa
- 7420 Via Paraiso
- 7395 Via Paraiso
- 7419 Via Salsipuedes
- 7383 Via Paraiso
- 7405 Via Paraiso
- 8393 Via Airosa
- 7402 Via Salsipuedes
- 7430 Via Paraiso
- 7419 Via Paraiso
- 7373 Via Paraiso
- 7429 Via Salsipuedes
- 8424 Via Airosa
- 8410 Via Airosa
- 8385 Via Airosa
- 8432 Via Airosa
- 7400 Alta Cuesta Dr