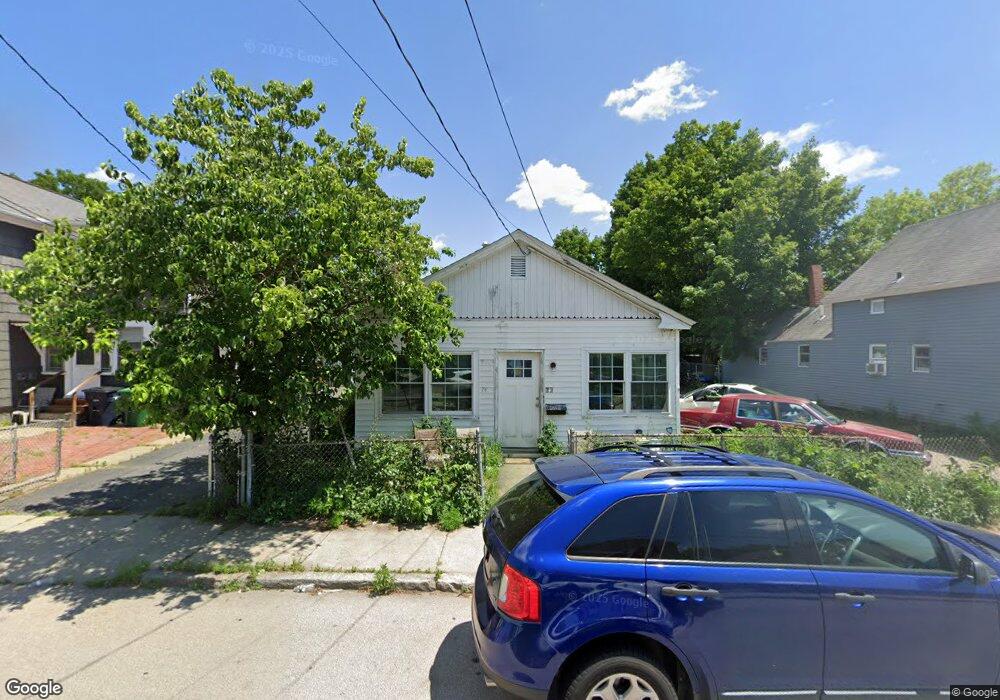
74 Ash St Nashua, NH 03060
South End Nashua NeighborhoodEstimated Value: $353,000 - $401,000
3
Beds
1
Bath
1,364
Sq Ft
$274/Sq Ft
Est. Value
About This Home
This home is located at 74 Ash St, Nashua, NH 03060 and is currently estimated at $373,317, approximately $273 per square foot. 74 Ash St is a home located in Hillsborough County with nearby schools including Ledge Street Elementary School, Elm Street Middle School, and Nashua High School South.
Ownership History
Date
Name
Owned For
Owner Type
Purchase Details
Closed on
Nov 1, 2007
Sold by
Marcum Russell L and Marcum Marie A
Bought by
Waweru Joseph M
Current Estimated Value
Home Financials for this Owner
Home Financials are based on the most recent Mortgage that was taken out on this home.
Original Mortgage
$121,410
Interest Rate
6.43%
Mortgage Type
Purchase Money Mortgage
Purchase Details
Closed on
Dec 3, 2001
Sold by
Pascoal Wayne G
Bought by
Kidd Peter S and Kidd Marie E
Home Financials for this Owner
Home Financials are based on the most recent Mortgage that was taken out on this home.
Original Mortgage
$148,400
Interest Rate
6.66%
Mortgage Type
Purchase Money Mortgage
Purchase Details
Closed on
Nov 26, 1996
Sold by
Pangia T
Bought by
Pascoal Wayne G and Pascoal Maureen F
Home Financials for this Owner
Home Financials are based on the most recent Mortgage that was taken out on this home.
Original Mortgage
$99,284
Interest Rate
7.81%
Mortgage Type
Purchase Money Mortgage
Create a Home Valuation Report for This Property
The Home Valuation Report is an in-depth analysis detailing your home's value as well as a comparison with similar homes in the area
Home Values in the Area
Average Home Value in this Area
Purchase History
| Date | Buyer | Sale Price | Title Company |
|---|---|---|---|
| Waweru Joseph M | $134,900 | -- | |
| Kidd Peter S | $164,900 | -- | |
| Pascoal Wayne G | $104,000 | -- |
Source: Public Records
Mortgage History
| Date | Status | Borrower | Loan Amount |
|---|---|---|---|
| Open | Pascoal Wayne G | $122,000 | |
| Closed | Pascoal Wayne G | $121,410 | |
| Previous Owner | Pascoal Wayne G | $148,400 | |
| Previous Owner | Pascoal Wayne G | $99,284 |
Source: Public Records
Tax History
| Year | Tax Paid | Tax Assessment Tax Assessment Total Assessment is a certain percentage of the fair market value that is determined by local assessors to be the total taxable value of land and additions on the property. | Land | Improvement |
|---|---|---|---|---|
| 2025 | $4,988 | $296,400 | $131,700 | $164,700 |
| 2024 | $4,713 | $296,400 | $131,700 | $164,700 |
| 2023 | $4,457 | $244,500 | $105,300 | $139,200 |
| 2022 | $4,418 | $244,500 | $105,300 | $139,200 |
| 2021 | $3,697 | $159,200 | $66,700 | $92,500 |
| 2020 | $3,600 | $159,200 | $66,700 | $92,500 |
| 2019 | $3,464 | $159,200 | $66,700 | $92,500 |
| 2018 | $3,377 | $159,200 | $66,700 | $92,500 |
| 2017 | $3,133 | $121,500 | $61,400 | $60,100 |
| 2016 | $3,046 | $121,500 | $61,400 | $60,100 |
| 2015 | $2,980 | $121,500 | $61,400 | $60,100 |
| 2014 | $2,922 | $121,500 | $61,400 | $60,100 |
Source: Public Records
Map
Nearby Homes
- 6 Buck St
- 103 Ash St
- 5 Middle St
- 22 Beech St
- 14 Mulberry St
- 14 Pleasant St
- 18-20 Maple St
- 17 1/2 Balcom St
- 15 Lovell St Unit 17
- 24 E Otterson St
- 169A W Hollis St Unit 193
- 14 Acton St
- 10 Saint Josephs Dr
- 11 Charles St
- 362 Main St
- 31 Lincoln Ave
- 13 Mulvanity St
- 5 Merrimack St
- 19 Cross St
- 14 Artillery Ln Unit A
Your Personal Tour Guide
Ask me questions while you tour the home.