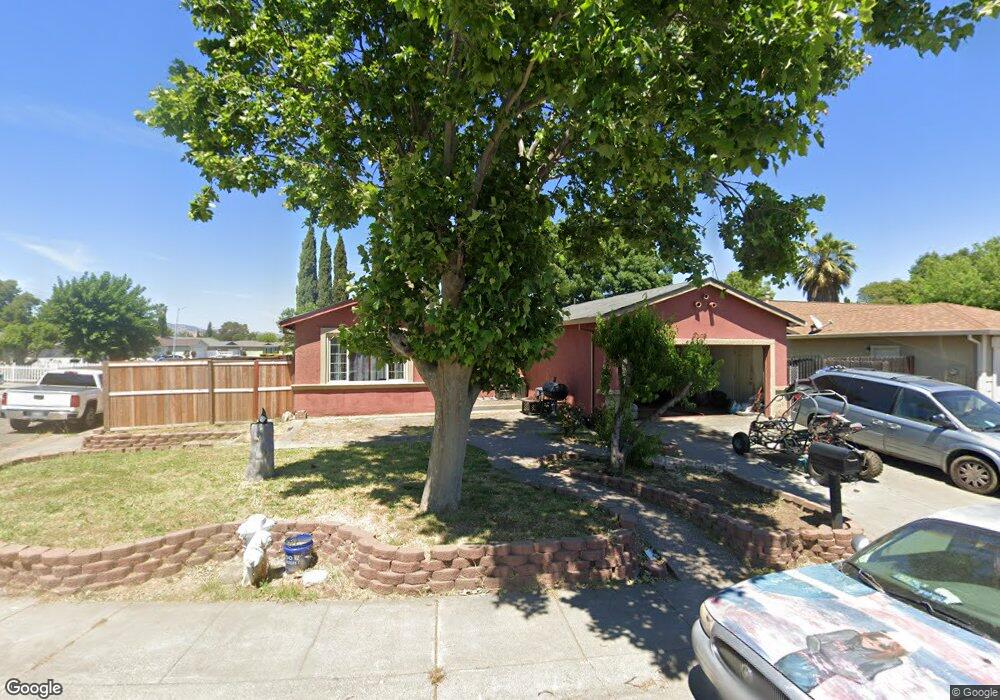
74 Chipman Ln Suisun City, CA 94585
Estimated Value: $467,395 - $528,000
3
Beds
2
Baths
1,342
Sq Ft
$370/Sq Ft
Est. Value
About This Home
This home is located at 74 Chipman Ln, Suisun City, CA 94585 and is currently estimated at $496,599, approximately $370 per square foot. 74 Chipman Ln is a home located in Solano County with nearby schools including Crescent Elementary School, Crystal Middle School, and Armijo High School.
Ownership History
Date
Name
Owned For
Owner Type
Purchase Details
Closed on
Mar 21, 2001
Sold by
Rangel Israel
Bought by
Rangel Rigoberto and Rangel Benita
Current Estimated Value
Home Financials for this Owner
Home Financials are based on the most recent Mortgage that was taken out on this home.
Original Mortgage
$102,000
Interest Rate
6.52%
Purchase Details
Closed on
Jul 16, 1997
Sold by
Northern Ca Conference Assn Seventh Day
Bought by
Rangel Rigoberto and Rangel Benita
Home Financials for this Owner
Home Financials are based on the most recent Mortgage that was taken out on this home.
Original Mortgage
$102,100
Interest Rate
7.83%
Purchase Details
Closed on
Jul 11, 1997
Sold by
Rangel Theresa Aguirre
Bought by
Rangel Israel
Home Financials for this Owner
Home Financials are based on the most recent Mortgage that was taken out on this home.
Original Mortgage
$102,100
Interest Rate
7.83%
Create a Home Valuation Report for This Property
The Home Valuation Report is an in-depth analysis detailing your home's value as well as a comparison with similar homes in the area
Home Values in the Area
Average Home Value in this Area
Purchase History
| Date | Buyer | Sale Price | Title Company |
|---|---|---|---|
| Rangel Rigoberto | $33,000 | Fidelity National Title Co | |
| Rangel Rigoberto | $107,500 | Fidelity National Title Co | |
| Rangel Israel | -- | Fidelity National Title Co |
Source: Public Records
Mortgage History
| Date | Status | Borrower | Loan Amount |
|---|---|---|---|
| Closed | Rangel Rigoberto | $102,000 | |
| Closed | Rangel Rigoberto | $102,100 |
Source: Public Records
Tax History Compared to Growth
Tax History
| Year | Tax Paid | Tax Assessment Tax Assessment Total Assessment is a certain percentage of the fair market value that is determined by local assessors to be the total taxable value of land and additions on the property. | Land | Improvement |
|---|---|---|---|---|
| 2025 | $1,938 | $171,641 | $47,897 | $123,744 |
| 2024 | $1,938 | $168,276 | $46,958 | $121,318 |
| 2023 | $1,879 | $164,978 | $46,038 | $118,940 |
| 2022 | $1,857 | $161,744 | $45,136 | $116,608 |
| 2021 | $1,839 | $158,573 | $44,251 | $114,322 |
| 2020 | $1,796 | $156,948 | $43,798 | $113,150 |
| 2019 | $1,752 | $153,872 | $42,940 | $110,932 |
| 2018 | $1,826 | $150,856 | $42,099 | $108,757 |
| 2017 | $1,744 | $147,899 | $41,274 | $106,625 |
| 2016 | $1,726 | $145,000 | $40,465 | $104,535 |
| 2015 | $1,612 | $142,823 | $39,858 | $102,965 |
| 2014 | $1,602 | $140,027 | $39,078 | $100,949 |
Source: Public Records
Map
Nearby Homes
- 79 Chipman Ln
- 85 Coral Ln
- 519 Rio Verde
- 56 Terry Ln
- 96 Coral Ln
- 914 Francisco Dr
- 8 Deck Dr
- 906 Taft St
- 230 Empire Place
- 249 E Tennessee St
- 950 Marina Cir
- 619 Wigeon Way
- 518 Carolina St
- 145 Summertime Ln
- 1207 E Tennessee St
- 141 Summertime Ln
- 813 Redhead Way
- 1105 Strawberry Ln
- 518 Empire St
- 800 Spoonbill Ln