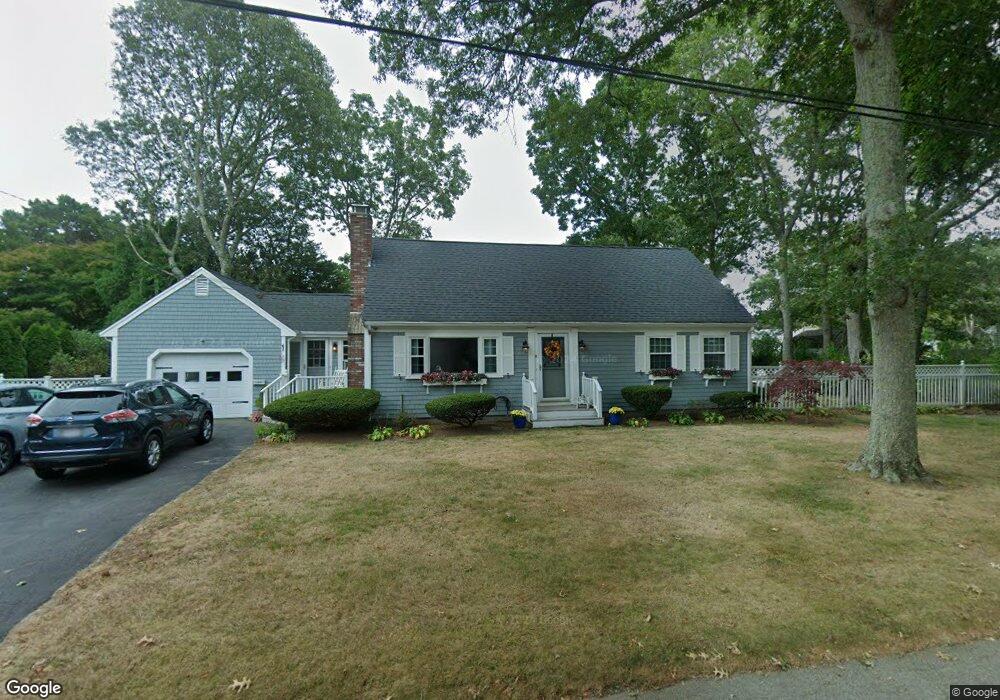
74 Perch Pond Cir Teaticket, MA 02536
Estimated Value: $782,761 - $862,000
4
Beds
2
Baths
1,801
Sq Ft
$461/Sq Ft
Est. Value
About This Home
This home is located at 74 Perch Pond Cir, Teaticket, MA 02536 and is currently estimated at $829,690, approximately $460 per square foot. 74 Perch Pond Cir is a home located in Barnstable County with nearby schools including Teaticket Elementary School, Morse Pond School, and Lawrence School.
Ownership History
Date
Name
Owned For
Owner Type
Purchase Details
Closed on
May 21, 1996
Sold by
Guidi Albert L and Guidi Marie J
Bought by
Miceli John B and Miceli Elsie C
Current Estimated Value
Home Financials for this Owner
Home Financials are based on the most recent Mortgage that was taken out on this home.
Original Mortgage
$65,500
Outstanding Balance
$3,654
Interest Rate
7.77%
Mortgage Type
Purchase Money Mortgage
Estimated Equity
$826,036
Purchase Details
Closed on
Jun 1, 1989
Sold by
Tobin Paul F
Bought by
Guidi Albert L
Create a Home Valuation Report for This Property
The Home Valuation Report is an in-depth analysis detailing your home's value as well as a comparison with similar homes in the area
Home Values in the Area
Average Home Value in this Area
Purchase History
| Date | Buyer | Sale Price | Title Company |
|---|---|---|---|
| Miceli John B | $130,000 | -- | |
| Miceli John B | $130,000 | -- | |
| Guidi Albert L | $155,000 | -- |
Source: Public Records
Mortgage History
| Date | Status | Borrower | Loan Amount |
|---|---|---|---|
| Open | Guidi Albert L | $25,000 | |
| Open | Guidi Albert L | $65,500 | |
| Closed | Guidi Albert L | $65,500 | |
| Previous Owner | Guidi Albert L | $106,000 |
Source: Public Records
Tax History Compared to Growth
Tax History
| Year | Tax Paid | Tax Assessment Tax Assessment Total Assessment is a certain percentage of the fair market value that is determined by local assessors to be the total taxable value of land and additions on the property. | Land | Improvement |
|---|---|---|---|---|
| 2025 | $3,672 | $625,600 | $247,900 | $377,700 |
| 2024 | $3,547 | $564,800 | $221,300 | $343,500 |
| 2023 | $3,277 | $473,500 | $177,100 | $296,400 |
| 2022 | $3,221 | $400,100 | $153,700 | $246,400 |
| 2021 | $3,081 | $362,500 | $147,100 | $215,400 |
| 2020 | $2,999 | $349,100 | $133,700 | $215,400 |
| 2019 | $2,942 | $343,700 | $133,700 | $210,000 |
| 2018 | $2,901 | $337,300 | $133,700 | $203,600 |
| 2017 | $2,714 | $318,200 | $133,700 | $184,500 |
| 2016 | $2,663 | $318,200 | $133,700 | $184,500 |
| 2015 | $2,606 | $318,200 | $133,700 | $184,500 |
| 2014 | $2,619 | $321,400 | $137,900 | $183,500 |
Source: Public Records
Map
Nearby Homes
- 110 Teaticket Path
- 19 Moniz Way
- 49 Broken Bow Ln
- 0 Sandwich Rd
- 0 Sandwich Rd Unit 22501377
- 7 Dexter Mill Dr
- 20 Swallow St
- 90 E Harbor Dr
- 16 Trotting Park Rd Unit 4B
- 16 Trotting Park Rd Unit 4B
- 16 Trotting Park Rd Unit 2B
- 16 Trotting Park Rd Unit 2B
- 100 Homestead Ln
- 2 Swallow St
- 49 Rivers End Rd
- 49 Saint Marks Rd
- 25 Percival Rd
- 16 Edgewood Dr
- 40 Wyndlea Cir
- 7 Montauk St
- 68 Perch Pond Cir
- 80 Perch Pond Cir
- 75 Perch Pond Cir
- 69 Perch Pond Cir
- 34 Jeffrey Ln
- 27 Perch Pond Cir
- 21 Perch Pond Cir
- 36 Jeffrey Ln
- 62 Perch Pond Cir
- 86 Perch Pond Cir
- 33 Perch Pond Cir
- 63 Perch Pond Cir
- 43 Perch Pond Cir
- 32 Jeffrey Ln
- 34 Maravista Avenue Extension
- 34 Maravista Avenue Extension
- 38 Jeffrey Ln
- 56 Perch Pond Cir
- 30 Jeffrey Ln
- 90 Perch Pond Cir