Estimated Value: $312,000 - $505,000
3
Beds
2
Baths
1,496
Sq Ft
$259/Sq Ft
Est. Value
About This Home
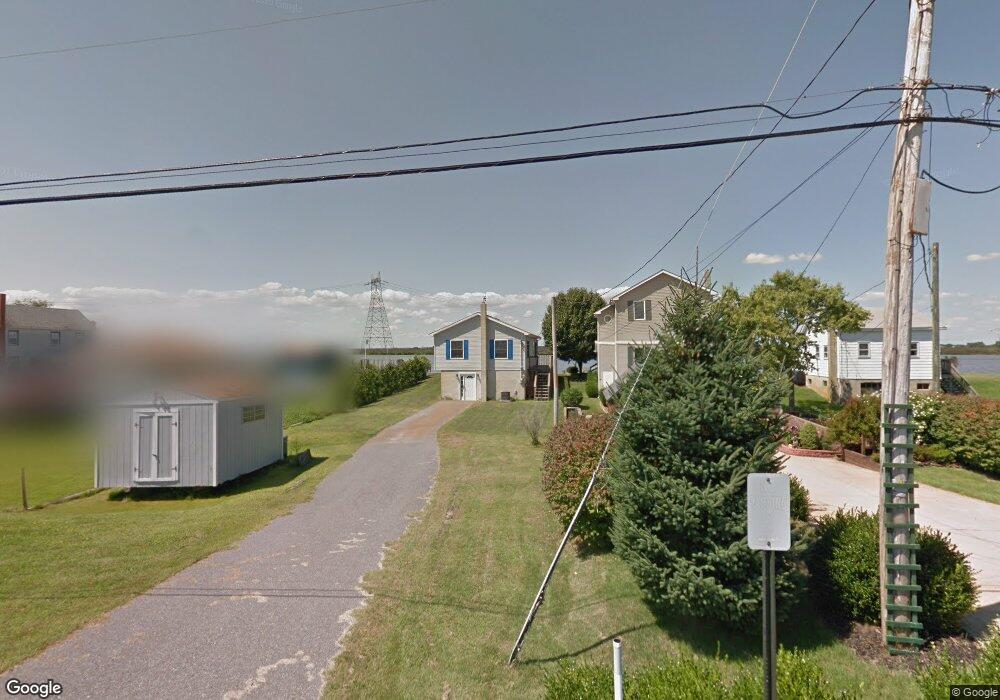
This home is located at 74 Sinnickson Landing Rd, Salem, NJ 08079 and is currently estimated at $387,282, approximately $258 per square foot. 74 Sinnickson Landing Rd is a home located in Salem County with nearby schools including Elsinboro Township School.
Ownership History
Date
Name
Owned For
Owner Type
Purchase Details
Closed on
Sep 29, 2011
Sold by
Harwood Arthur P and Harwood Lynn H
Bought by
Ingraldi Lucia
Current Estimated Value
Home Financials for this Owner
Home Financials are based on the most recent Mortgage that was taken out on this home.
Original Mortgage
$252,000
Outstanding Balance
$172,700
Interest Rate
4.2%
Mortgage Type
Purchase Money Mortgage
Estimated Equity
$214,582
Purchase Details
Closed on
Feb 12, 2001
Sold by
Harwood Arthur P
Bought by
Harwood Arthur P and Harwood Lynn H
Purchase Details
Closed on
Oct 31, 1995
Sold by
Mahoney Eileen M and Mahoney James E
Bought by
Harwood Arthur P
Create a Home Valuation Report for This Property
The Home Valuation Report is an in-depth analysis detailing your home's value as well as a comparison with similar homes in the area
Home Values in the Area
Average Home Value in this Area
Purchase History
| Date | Buyer | Sale Price | Title Company |
|---|---|---|---|
| Ingraldi Lucia | $280,000 | -- | |
| Harwood Arthur P | -- | -- | |
| Harwood Arthur P | $86,000 | Heritage Title & Abstract Ag |
Source: Public Records
Mortgage History
| Date | Status | Borrower | Loan Amount |
|---|---|---|---|
| Open | Ingraldi Lucia | $252,000 |
Source: Public Records
Tax History Compared to Growth
Tax History
| Year | Tax Paid | Tax Assessment Tax Assessment Total Assessment is a certain percentage of the fair market value that is determined by local assessors to be the total taxable value of land and additions on the property. | Land | Improvement |
|---|---|---|---|---|
| 2025 | $8,502 | $272,500 | $86,000 | $186,500 |
| 2024 | $8,058 | $272,500 | $86,000 | $186,500 |
| 2023 | $8,058 | $272,500 | $86,000 | $186,500 |
| 2022 | $7,856 | $272,500 | $86,000 | $186,500 |
| 2021 | $7,581 | $272,500 | $86,000 | $186,500 |
| 2020 | $7,690 | $272,500 | $86,000 | $186,500 |
| 2019 | $7,581 | $272,500 | $86,000 | $186,500 |
| 2018 | $7,404 | $272,500 | $86,000 | $186,500 |
| 2017 | $7,254 | $272,500 | $86,000 | $186,500 |
| 2016 | $6,990 | $272,500 | $86,000 | $186,500 |
| 2015 | $6,600 | $272,500 | $86,000 | $186,500 |
| 2014 | $6,385 | $272,500 | $86,000 | $186,500 |
Source: Public Records
Map
Nearby Homes
- 92 Sinnickson Landing Rd
- 9 S Tilbury Rd
- 40 Morning Side Dr
- 251 Chestnut St
- 10 Delaware Dr
- 197 Pine Ave
- 249 Chestnut St
- 0 Crossland Ave
- 179 Victory Ave
- 75 Hedge St Unit 2 RR
- 68 Amwellbury Rd
- 25 Riverview Dr
- 87-89 W Broadway
- 44 Delaware Ave
- 12 Oak St
- 304 New Market St
- 60 62 Walnut St
- 4 Belden St
- 217 Smith St
- 46 Walnut St
- 72 Sinnickson Landing Rd
- 76 Sinnickson Landing Rd
- 78 Sinnickson Landing Rd
- 70 Sinnickson Landing Rd
- 80 Sinnickson Landing Rd Unit ELSINBORO
- 80 Sinnickson Landing Rd
- 81 Sinnickson Landing Rd
- 79 Sinnickson Landing Rd
- 88 Sinnickson Landing Rd
- 75 Sinnickson Landing Rd
- 75 Sinnickson Landing Rd
- 90 Sinnickson Landing Rd
- 96 Sinnickson Landing Rd
- 54 Sinnickson Landing Rd
- 52 Sinnickson Landing Rd
- 40 Garden Dr
- 50 Sinnickson Landing Rd
- 46 Sinnickson Landing Rd
- 42 Sinnickson Landing Rd
- 17A Garden Dr