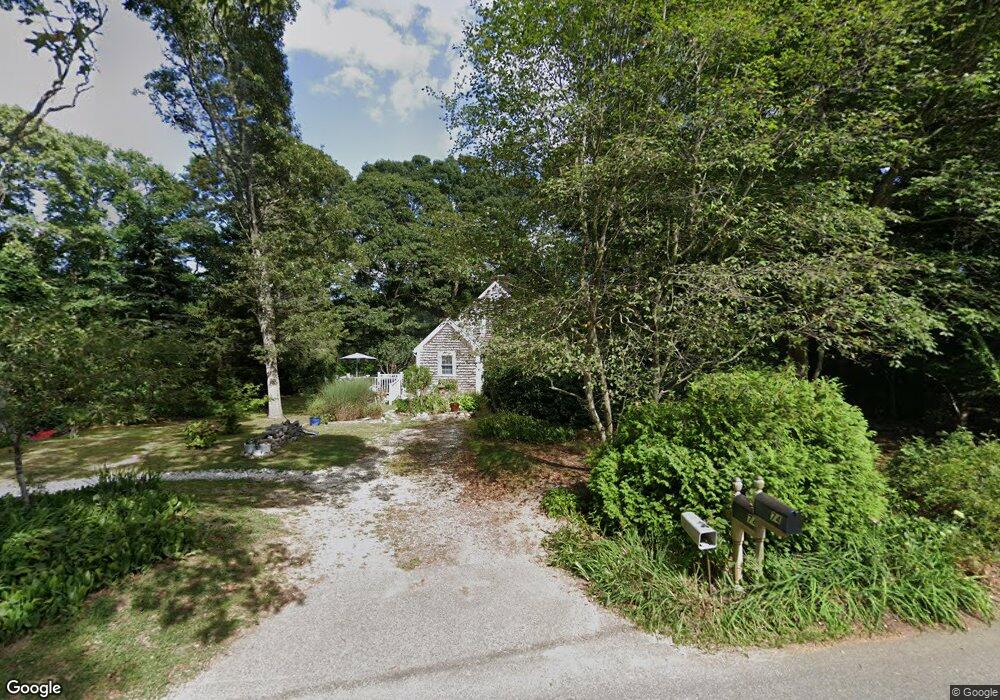
74 Swamp Rd Brewster, MA 02631
Estimated Value: $669,000 - $887,000
3
Beds
2
Baths
1,436
Sq Ft
$550/Sq Ft
Est. Value
About This Home
This home is located at 74 Swamp Rd, Brewster, MA 02631 and is currently estimated at $790,369, approximately $550 per square foot. 74 Swamp Rd is a home located in Barnstable County with nearby schools including Stony Brook Elementary School, Eddy Elementary School, and Nauset Regional Middle School.
Ownership History
Date
Name
Owned For
Owner Type
Purchase Details
Closed on
Apr 16, 2025
Sold by
Belliveau Leah H
Bought by
Leahs Ft and Belliveau
Current Estimated Value
Purchase Details
Closed on
Mar 31, 2008
Sold by
Belliveau Gerald A and Belliveau Leah H
Bought by
Belliveau Leah H
Home Financials for this Owner
Home Financials are based on the most recent Mortgage that was taken out on this home.
Original Mortgage
$200,000
Interest Rate
5.76%
Mortgage Type
Purchase Money Mortgage
Purchase Details
Closed on
Jan 3, 1995
Sold by
Groom James R and Groom Maryann M
Bought by
Belliveau Gerald A and Belliveau Leah H
Purchase Details
Closed on
May 24, 1988
Sold by
Cape Cod Five Ct Sb
Bought by
Groom James R
Create a Home Valuation Report for This Property
The Home Valuation Report is an in-depth analysis detailing your home's value as well as a comparison with similar homes in the area
Home Values in the Area
Average Home Value in this Area
Purchase History
| Date | Buyer | Sale Price | Title Company |
|---|---|---|---|
| Leahs Ft | -- | None Available | |
| Leahs Ft | -- | None Available | |
| Belliveau Leah H | -- | -- | |
| Belliveau Leah H | -- | -- | |
| Belliveau Leah H | -- | -- | |
| Belliveau Gerald A | $120,000 | -- | |
| Belliveau Gerald A | $120,000 | -- | |
| Groom James R | $121,000 | -- |
Source: Public Records
Mortgage History
| Date | Status | Borrower | Loan Amount |
|---|---|---|---|
| Previous Owner | Groom James R | $199,000 | |
| Previous Owner | Belliveau Leah H | $200,000 |
Source: Public Records
Tax History Compared to Growth
Tax History
| Year | Tax Paid | Tax Assessment Tax Assessment Total Assessment is a certain percentage of the fair market value that is determined by local assessors to be the total taxable value of land and additions on the property. | Land | Improvement |
|---|---|---|---|---|
| 2025 | $5,019 | $729,500 | $396,800 | $332,700 |
| 2024 | $4,689 | $688,600 | $374,400 | $314,200 |
| 2023 | $4,331 | $619,600 | $334,200 | $285,400 |
| 2022 | $3,931 | $500,800 | $262,100 | $238,700 |
| 2021 | $3,767 | $439,000 | $227,800 | $211,200 |
| 2020 | $3,699 | $429,100 | $227,800 | $201,300 |
| 2019 | $3,570 | $416,100 | $219,100 | $197,000 |
| 2018 | $3,375 | $408,600 | $219,100 | $189,500 |
| 2017 | $3,349 | $399,200 | $219,100 | $180,100 |
| 2016 | $3,235 | $383,700 | $214,900 | $168,800 |
| 2015 | $3,121 | $377,800 | $210,600 | $167,200 |
Source: Public Records
Map
Nearby Homes
- 92 Swamp Rd
- 67 Swamp Rd
- 60 Swamp Rd
- 83 Swamp Rd
- 101 Swamp Rd
- 108 Swamp Rd
- 121 Swamp Rd
- 138 Swamp Rd
- 1573-1577 Main St
- 1573 Main St
- 0 Cranes Ln Unit 71500828
- 0 Cranes Ln Unit 71644812
- 0 Alden Dr
- 0 Cranes Ln Unit 9902790
- 0 Cranes Ln Unit 21301947
- 0 Cranes Ln Unit 21405657
- 0 Maclean Rd
- 140 Swamp Rd
- 1567 Main St
- 145 Swamp Rd