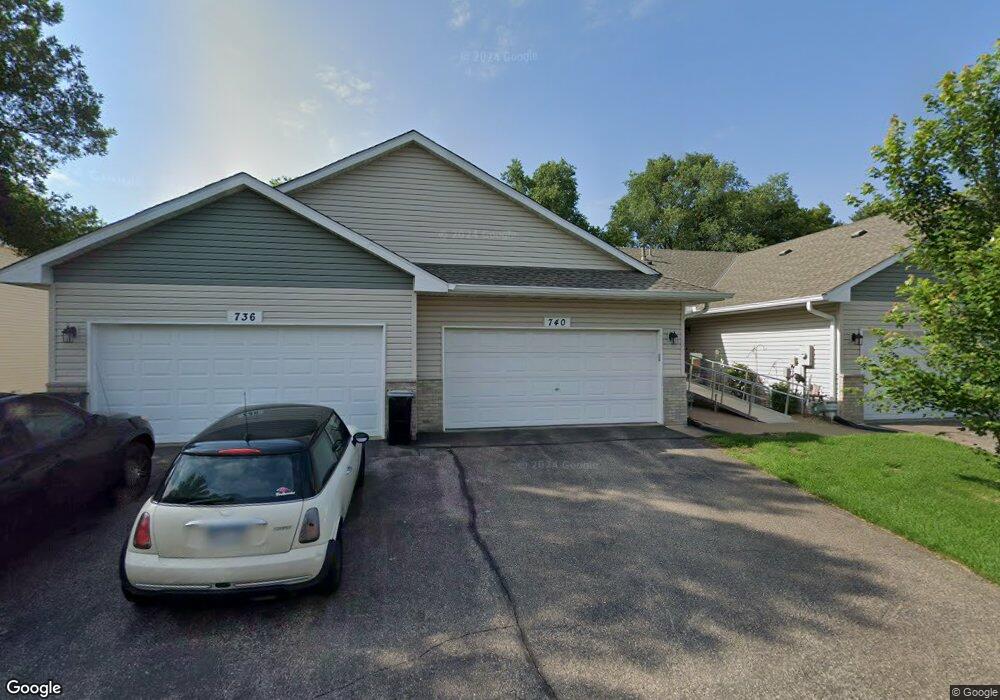
740 86th Ln NW Coon Rapids, MN 55433
Estimated Value: $234,694 - $263,000
2
Beds
2
Baths
908
Sq Ft
$275/Sq Ft
Est. Value
About This Home
This home is located at 740 86th Ln NW, Coon Rapids, MN 55433 and is currently estimated at $249,674, approximately $274 per square foot. 740 86th Ln NW is a home located in Anoka County with nearby schools including Adams Elementary School, Coon Rapids Middle School, and Coon Rapids Senior High School.
Ownership History
Date
Name
Owned For
Owner Type
Purchase Details
Closed on
May 1, 2017
Sold by
Erickson Benjamin O and Erickson Julie
Bought by
Bundy James
Current Estimated Value
Home Financials for this Owner
Home Financials are based on the most recent Mortgage that was taken out on this home.
Original Mortgage
$158,110
Outstanding Balance
$131,954
Interest Rate
4.23%
Mortgage Type
New Conventional
Estimated Equity
$117,720
Purchase Details
Closed on
Sep 22, 2005
Sold by
Vik James A and Vik Catherine E
Bought by
Erickson Benjamin O and Beitz Julie M
Purchase Details
Closed on
Dec 4, 2002
Sold by
Mariani Adair L
Bought by
Vik James A and Vik Catherine E
Purchase Details
Closed on
Dec 22, 1998
Sold by
Prime Builders Inc
Bought by
Mariani Adair L
Create a Home Valuation Report for This Property
The Home Valuation Report is an in-depth analysis detailing your home's value as well as a comparison with similar homes in the area
Home Values in the Area
Average Home Value in this Area
Purchase History
| Date | Buyer | Sale Price | Title Company |
|---|---|---|---|
| Bundy James | $163,000 | Trademark Title Services Inc | |
| Erickson Benjamin O | $187,000 | -- | |
| Vik James A | $148,000 | -- | |
| Mariani Adair L | $100,982 | -- |
Source: Public Records
Mortgage History
| Date | Status | Borrower | Loan Amount |
|---|---|---|---|
| Open | Bundy James | $158,110 |
Source: Public Records
Tax History
| Year | Tax Paid | Tax Assessment Tax Assessment Total Assessment is a certain percentage of the fair market value that is determined by local assessors to be the total taxable value of land and additions on the property. | Land | Improvement |
|---|---|---|---|---|
| 2025 | $2,510 | $259,100 | $50,000 | $209,100 |
| 2024 | $2,510 | $250,000 | $50,000 | $200,000 |
| 2023 | $2,289 | $232,200 | $45,500 | $186,700 |
| 2022 | $2,201 | $242,600 | $40,000 | $202,600 |
| 2021 | $2,124 | $209,800 | $24,000 | $185,800 |
| 2020 | $1,964 | $198,900 | $20,000 | $178,900 |
| 2019 | $1,895 | $179,100 | $15,000 | $164,100 |
| 2018 | $1,756 | $169,000 | $0 | $0 |
| 2017 | $1,614 | $154,300 | $0 | $0 |
| 2016 | $1,738 | $148,000 | $0 | $0 |
| 2015 | -- | $148,000 | $18,900 | $129,100 |
| 2014 | -- | $118,600 | $8,000 | $110,600 |
Source: Public Records
Map
Nearby Homes
- 691 85th Ln NW Unit 7
- 8807 Norway St NW
- 602 84th Ln NW
- 8436 Palm St NW
- 8420 Palm St NW
- 8456 Mississippi Blvd NW
- 571 Ironton St NE
- 565 Hugo St NE
- 9217 W River Rd
- 601 Glencoe St NE
- 548 Fairmont St NE
- 7998 E River Rd
- 614 Cheryl St NE
- 1650 89th Ave N
- 20 94th Cir NW Unit 203
- 9157 3rd St NE
- xxxxx Pearson Way NE
- 9242 5th St NE
- 2013 91st Ln N
- 185 Craigbrook Way NE
- 736 86th Ln NW Unit 75
- 744 86th Ln NW Unit 77
- 748 86th Ln NW
- 732 86th Ln NW Unit 74
- 752 86th Ln NW
- 728 86th Ln NW Unit 73
- 756 86th Ln NW
- 724 86th Ln NW Unit 72
- 739 86th Ln NW
- 747 86th Ln NW
- 743 86th Ln NW Unit 91
- 735 86th Ln NW
- 720 86th Ln NW Unit 7
- 749 86th Ave NW Unit 11
- 731 86th Ln NW
- 753 86th Ave NW Unit 10
- 751 86th Ln NW
- 745 86th Ave NW Unit 12
- 757 86th Ave NW Unit 9
- 755 86th Ln NW Unit 88
Your Personal Tour Guide
Ask me questions while you tour the home.