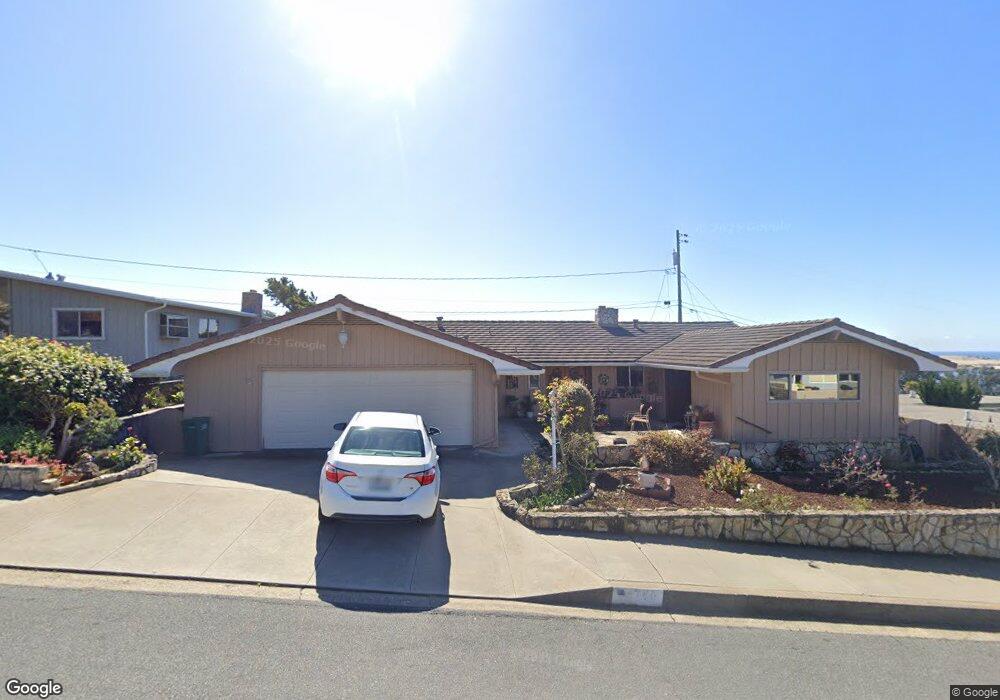
740 Alta Ct Morro Bay, CA 93442
Estimated Value: $1,509,436 - $1,914,000
3
Beds
2
Baths
2,370
Sq Ft
$697/Sq Ft
Est. Value
About This Home
This home is located at 740 Alta Ct, Morro Bay, CA 93442 and is currently estimated at $1,651,109, approximately $696 per square foot. 740 Alta Ct is a home located in San Luis Obispo County with nearby schools including Del Mar Elementary School, Los Osos Middle School, and Morro Bay High School.
Ownership History
Date
Name
Owned For
Owner Type
Purchase Details
Closed on
Dec 20, 2016
Sold by
Spitzer Ryan J and Spitzer Ross E
Bought by
Spitzer Ryan J and Spitzer Ross E
Current Estimated Value
Purchase Details
Closed on
Dec 21, 2015
Sold by
Spitzer Ryan J and Spitzer Ross E
Bought by
Herbert Spitzer Revocable Trust and Spitzer Ross E
Purchase Details
Closed on
Sep 3, 2015
Sold by
Spitzer Partners
Bought by
Spitzer Ryan J and Spitzer Ross E
Purchase Details
Closed on
Feb 14, 2000
Sold by
Nunes Manuel
Bought by
Spitzer Partners
Create a Home Valuation Report for This Property
The Home Valuation Report is an in-depth analysis detailing your home's value as well as a comparison with similar homes in the area
Home Values in the Area
Average Home Value in this Area
Purchase History
| Date | Buyer | Sale Price | Title Company |
|---|---|---|---|
| Spitzer Ryan J | -- | None Available | |
| Herbert Spitzer Revocable Trust | -- | None Available | |
| Spitzer Ryan J | -- | None Available | |
| Spitzer Partners | $445,000 | Chicago Title |
Source: Public Records
Tax History
| Year | Tax Paid | Tax Assessment Tax Assessment Total Assessment is a certain percentage of the fair market value that is determined by local assessors to be the total taxable value of land and additions on the property. | Land | Improvement |
|---|---|---|---|---|
| 2025 | $8,598 | $800,689 | $450,787 | $349,902 |
| 2024 | $8,441 | $784,991 | $441,949 | $343,042 |
| 2023 | $8,441 | $769,600 | $433,284 | $336,316 |
| 2022 | $7,911 | $754,511 | $424,789 | $329,722 |
| 2021 | $7,783 | $739,717 | $416,460 | $323,257 |
| 2020 | $7,703 | $732,133 | $412,190 | $319,943 |
| 2019 | $7,621 | $717,778 | $404,108 | $313,670 |
| 2018 | $7,470 | $703,705 | $396,185 | $307,520 |
| 2017 | $7,322 | $689,908 | $388,417 | $301,491 |
| 2016 | $7,252 | $577,754 | $311,598 | $266,156 |
| 2015 | $6,100 | $569,077 | $306,918 | $262,159 |
| 2014 | $5,602 | $557,930 | $300,906 | $257,024 |
Source: Public Records
Map
Nearby Homes
- 190 Main St Unit 25
- 173 Sandpiper Ln
- 163 Sandpiper Ln
- 444 Kings Ave
- 1000 Ridgeway St
- 436 Morro Ave
- 941 Marina St
- 485 Morro Ave
- 245 Driftwood St
- 600 Morro Bay Blvd Unit B
- 731 Butte Ave
- 960 Las Tunas St
- 260 Pacific St
- 240 Pacific St
- 1111 Main St
- 1151 Main St
- 1187 Main St
- 1260 Main St
- 545 Quinn Ct
- 369 Dunbar St
Your Personal Tour Guide
Ask me questions while you tour the home.