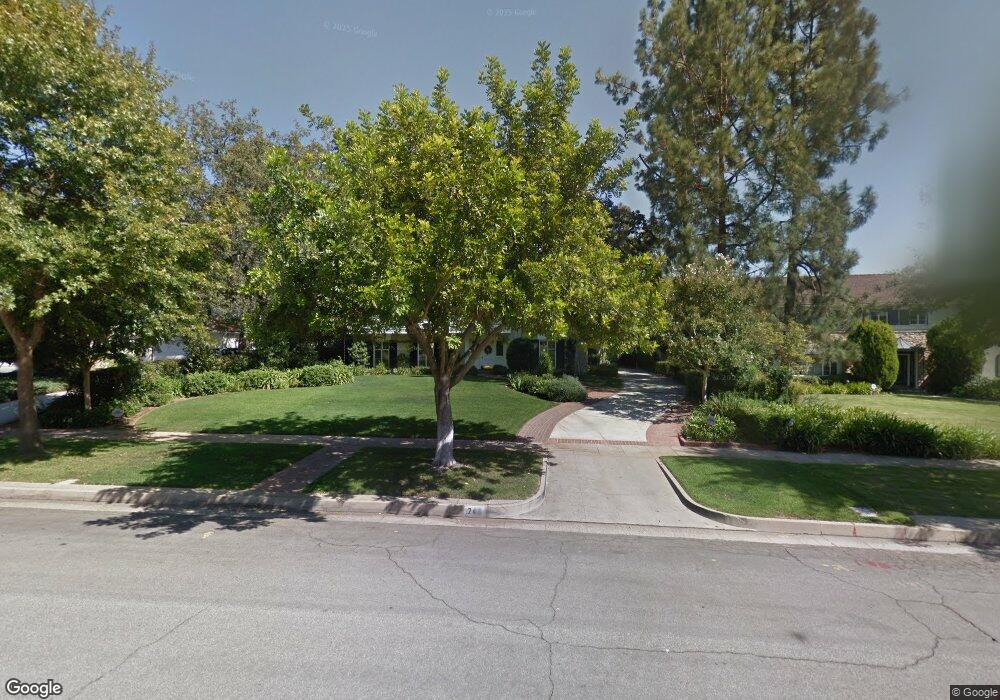
740 Chaucer Rd San Marino, CA 91108
Estimated Value: $4,270,000 - $4,692,000
4
Beds
4
Baths
3,891
Sq Ft
$1,150/Sq Ft
Est. Value
About This Home
This home is located at 740 Chaucer Rd, San Marino, CA 91108 and is currently estimated at $4,474,226, approximately $1,149 per square foot. 740 Chaucer Rd is a home located in Los Angeles County with nearby schools including Carver Elementary, Huntington Middle School, and San Marino High School.
Ownership History
Date
Name
Owned For
Owner Type
Purchase Details
Closed on
Oct 9, 2023
Sold by
Rogers Jennifer Gayle
Bought by
Jennifer Gayle Rogers Family Trust and Rogers
Current Estimated Value
Purchase Details
Closed on
Dec 24, 2022
Sold by
Qtip Trust
Bought by
Rogers Jennifer Gayle
Purchase Details
Closed on
Oct 2, 2007
Sold by
Rogers Stephen England and Rogers Janet Gimbel
Bought by
Rogers Stephen England and Rogers Janet Gimbel
Purchase Details
Closed on
May 2, 2002
Sold by
Rogers Janet Gimbel
Bought by
Rogers Janet Gimbel and Rogers Janet Gimbel
Purchase Details
Closed on
Apr 9, 2001
Sold by
Rogers Janet Gimbel and Gimbel Thomas William
Bought by
Rogers Janet Gimbel
Purchase Details
Closed on
Dec 9, 1998
Sold by
Gimbel William T and Gimbel Georgina T
Bought by
Gimbel William Thomas and Gimbel Georgina Tiffany
Create a Home Valuation Report for This Property
The Home Valuation Report is an in-depth analysis detailing your home's value as well as a comparison with similar homes in the area
Home Values in the Area
Average Home Value in this Area
Purchase History
| Date | Buyer | Sale Price | Title Company |
|---|---|---|---|
| Jennifer Gayle Rogers Family Trust | -- | None Listed On Document | |
| Rogers Jennifer Gayle | -- | -- | |
| Rogers Family Trust | -- | -- | |
| Rogers Stephen England | -- | None Available | |
| Rogers Stephen England | -- | None Available | |
| Rogers Janet Gimbel | -- | -- | |
| Rogers Janet Gimbel | -- | -- | |
| Gimbel William Thomas | -- | -- |
Source: Public Records
Tax History Compared to Growth
Tax History
| Year | Tax Paid | Tax Assessment Tax Assessment Total Assessment is a certain percentage of the fair market value that is determined by local assessors to be the total taxable value of land and additions on the property. | Land | Improvement |
|---|---|---|---|---|
| 2025 | $43,534 | $3,745,854 | $2,996,684 | $749,170 |
| 2024 | $43,534 | $3,672,407 | $2,937,926 | $734,481 |
| 2023 | $6,935 | $342,007 | $156,441 | $185,566 |
| 2022 | $6,739 | $335,302 | $153,374 | $181,928 |
| 2021 | $6,605 | $328,728 | $150,367 | $178,361 |
| 2019 | $6,450 | $318,980 | $145,908 | $173,072 |
| 2018 | $6,235 | $312,727 | $143,048 | $169,679 |
| 2016 | $5,904 | $300,586 | $137,495 | $163,091 |
| 2015 | $5,788 | $296,072 | $135,430 | $160,642 |
| 2014 | $5,745 | $290,274 | $132,778 | $157,496 |
Source: Public Records
Map
Nearby Homes
- 2290 Lombardy Rd
- 627 Winston Ave
- 935 Sierra Madre Blvd
- 500 Sierra Vista Ave
- 670 San Marino Ave
- 2110 Homet Rd
- 375 S Sierra Madre Blvd Unit B
- 1200 Oakwood Dr
- 2065 Oakdale St
- 1886 San Pasqual St
- 2786 E California Blvd
- 620 S Allen Ave
- 353 S Berkeley Ave
- 2386 E Del Mar Blvd Unit 304
- 2386 E Del Mar Blvd Unit 301
- 2386 E Del Mar Blvd Unit 226
- 188 S Sierra Madre Blvd Unit 8
- 188 S Sierra Madre Blvd Unit 10
- 2976 Lombardy Rd
- 837 El Campo Dr
- 730 Chaucer Rd
- 760 Chaucer Rd
- 770 Chaucer Rd
- 710 Chaucer Rd
- 745 Sierra Madre Blvd
- 725 Sierra Madre Blvd
- 765 Sierra Madre Blvd
- 735 Chaucer Rd
- 800 Canterbury Rd
- 2370 Lombardy Rd
- 755 Chaucer Rd
- 705 Chaucer Rd
- 785 Sierra Madre Blvd
- 850 Canterbury Rd
- 775 Chaucer Rd
- 690 Chaucer Rd
- 805 Sierra Madre Blvd
- 2375 Lombardy Rd
- 815 Sierra Madre Blvd
- 674 Chaucer Rd