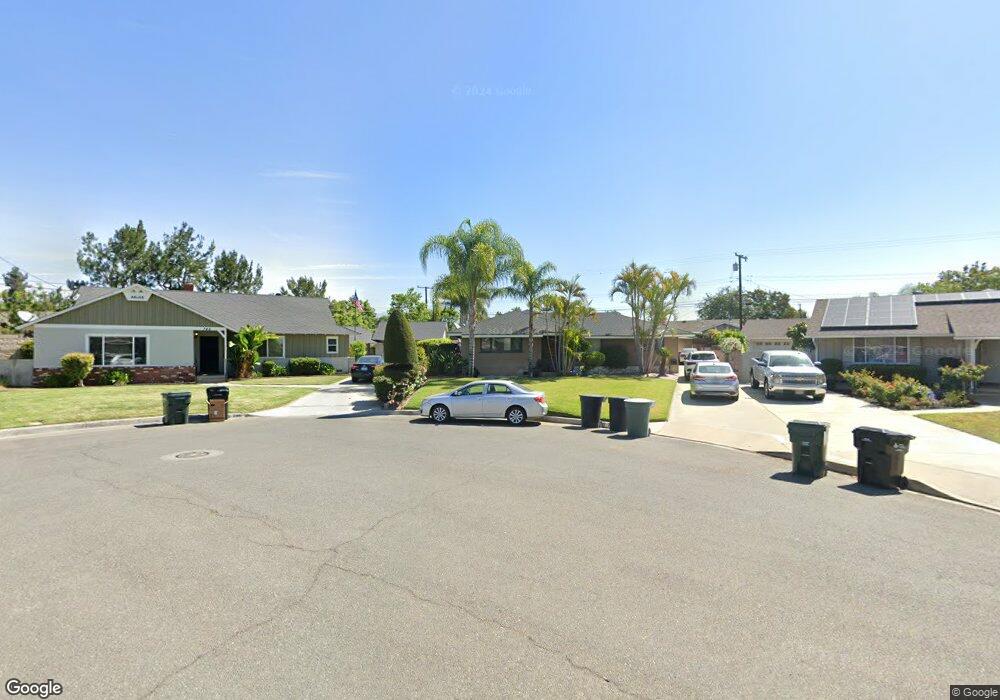
740 N Neil St West Covina, CA 91791
Estimated Value: $898,000 - $1,030,000
4
Beds
2
Baths
1,988
Sq Ft
$472/Sq Ft
Est. Value
About This Home
This home is located at 740 N Neil St, West Covina, CA 91791 and is currently estimated at $938,428, approximately $472 per square foot. 740 N Neil St is a home located in Los Angeles County with nearby schools including Workman Elementary School, Traweek Middle School, and Covina High School.
Ownership History
Date
Name
Owned For
Owner Type
Purchase Details
Closed on
May 15, 2017
Sold by
Ojeda Vianey and The Vianey Ojeda Revocable Liv
Bought by
Amescua Raoul H and Ojeda Vianey
Current Estimated Value
Purchase Details
Closed on
Aug 19, 2005
Sold by
Ojeda Vianey
Bought by
Ojeda Vianey
Home Financials for this Owner
Home Financials are based on the most recent Mortgage that was taken out on this home.
Original Mortgage
$265,000
Outstanding Balance
$138,760
Interest Rate
5.61%
Mortgage Type
New Conventional
Estimated Equity
$799,668
Purchase Details
Closed on
Jun 7, 2005
Sold by
Leon Alfred R and Leon Vianey Ojeda
Bought by
Ojeda Vianey
Purchase Details
Closed on
Aug 23, 2000
Sold by
Ojeda Pedro L and Ojeda Josefina D
Bought by
Leon Alfred R and Leon Vianey O
Home Financials for this Owner
Home Financials are based on the most recent Mortgage that was taken out on this home.
Original Mortgage
$200,000
Interest Rate
6.74%
Create a Home Valuation Report for This Property
The Home Valuation Report is an in-depth analysis detailing your home's value as well as a comparison with similar homes in the area
Home Values in the Area
Average Home Value in this Area
Purchase History
| Date | Buyer | Sale Price | Title Company |
|---|---|---|---|
| Amescua Raoul H | -- | None Available | |
| Ojeda Vianey | -- | Landsafe Title | |
| Ojeda Vianey | -- | -- | |
| Leon Alfred R | -- | -- |
Source: Public Records
Mortgage History
| Date | Status | Borrower | Loan Amount |
|---|---|---|---|
| Open | Ojeda Vianey | $265,000 | |
| Previous Owner | Leon Alfred R | $200,000 |
Source: Public Records
Tax History Compared to Growth
Tax History
| Year | Tax Paid | Tax Assessment Tax Assessment Total Assessment is a certain percentage of the fair market value that is determined by local assessors to be the total taxable value of land and additions on the property. | Land | Improvement |
|---|---|---|---|---|
| 2025 | $4,113 | $301,867 | $120,740 | $181,127 |
| 2024 | $4,113 | $295,949 | $118,373 | $177,576 |
| 2023 | $4,054 | $290,147 | $116,052 | $174,095 |
| 2022 | $4,001 | $284,459 | $113,777 | $170,682 |
| 2021 | $3,936 | $278,883 | $111,547 | $167,336 |
| 2019 | $3,840 | $270,614 | $108,240 | $162,374 |
| 2018 | $7,321 | $585,700 | $380,000 | $205,700 |
| 2017 | $3,516 | $260,108 | $104,038 | $156,070 |
| 2016 | $3,358 | $255,009 | $101,999 | $153,010 |
| 2015 | $3,276 | $251,179 | $100,467 | $150,712 |
| 2014 | $3,239 | $246,259 | $98,499 | $147,760 |
Source: Public Records
Map
Nearby Homes
- 708 N La Breda Ave
- 543 W Puente St Unit 3
- 123 S Hollenbeck Ave
- 511 W Puente St Unit 4
- 511 W Puente St Unit 1
- 193 S Hollenbeck Ave
- 229 Scratch Rd
- 627 W Front St
- 577 S Albertson Ave
- 501 Embrook Way
- 1147 W Badillo St Unit G
- 1147 W Badillo St Unit D
- 509 Tamarind Way Unit B
- 1122 W Glentana St
- 265 W Pershing Ct
- 1714 E Idahome St
- 216 W Merlot Dr Unit 58
- 554 N Cabernet Dr
- 839 Lexi Ln Unit 76
- 834 Lexi Ln Unit 73