Estimated Value: $146,000 - $149,000
2
Beds
1
Bath
912
Sq Ft
$161/Sq Ft
Est. Value
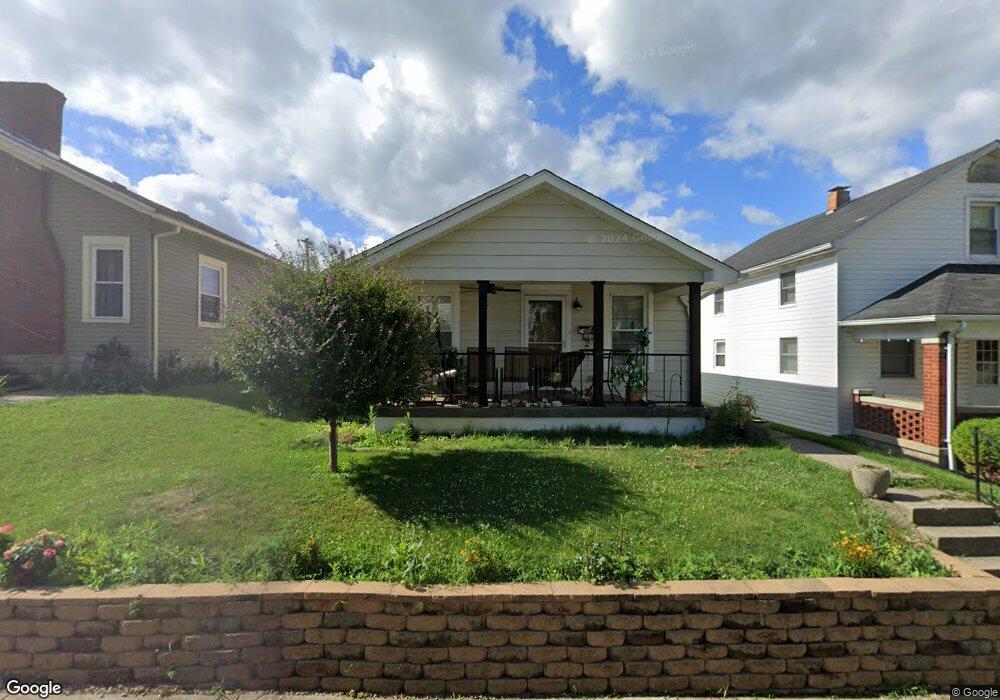
About This Home
This home is located at 740 Vine St, Piqua, OH 45356 and is currently estimated at $147,258, approximately $161 per square foot. 740 Vine St is a home located in Miami County with nearby schools including Piqua Central Intermediate School, Springcreek Primary School, and Piqua Junior High School.
Ownership History
Date
Name
Owned For
Owner Type
Purchase Details
Closed on
Sep 6, 2018
Sold by
J D Sullenberger Llc
Bought by
Vonaschen Gerald O and Vonaschen Gail Von
Current Estimated Value
Home Financials for this Owner
Home Financials are based on the most recent Mortgage that was taken out on this home.
Original Mortgage
$77,077
Interest Rate
4.5%
Mortgage Type
FHA
Purchase Details
Closed on
May 2, 2018
Sold by
Clark Jacqueline N
Bought by
Jd Sullenberger Llc
Purchase Details
Closed on
Jan 1, 1990
Bought by
Clark Richard E
Create a Home Valuation Report for This Property
The Home Valuation Report is an in-depth analysis detailing your home's value as well as a comparison with similar homes in the area
Home Values in the Area
Average Home Value in this Area
Purchase History
| Date | Buyer | Sale Price | Title Company |
|---|---|---|---|
| Vonaschen Gerald O | $78,500 | None Available | |
| Jd Sullenberger Llc | $30,000 | -- | |
| Clark Richard E | -- | -- |
Source: Public Records
Mortgage History
| Date | Status | Borrower | Loan Amount |
|---|---|---|---|
| Previous Owner | Vonaschen Gerald O | $77,077 |
Source: Public Records
Tax History Compared to Growth
Tax History
| Year | Tax Paid | Tax Assessment Tax Assessment Total Assessment is a certain percentage of the fair market value that is determined by local assessors to be the total taxable value of land and additions on the property. | Land | Improvement |
|---|---|---|---|---|
| 2024 | $928 | $32,380 | $7,910 | $24,470 |
| 2023 | $928 | $32,380 | $7,910 | $24,470 |
| 2022 | $988 | $32,380 | $7,910 | $24,470 |
| 2021 | $739 | $24,920 | $6,090 | $18,830 |
| 2020 | $724 | $24,920 | $6,090 | $18,830 |
| 2019 | $1,123 | $24,920 | $6,090 | $18,830 |
| 2018 | $529 | $19,960 | $6,340 | $13,620 |
| 2017 | $535 | $19,960 | $6,340 | $13,620 |
| 2016 | $529 | $19,960 | $6,340 | $13,620 |
| 2015 | $504 | $19,180 | $6,090 | $13,090 |
| 2014 | $504 | $19,180 | $6,090 | $13,090 |
| 2013 | $506 | $19,180 | $6,090 | $13,090 |
Source: Public Records
Map
Nearby Homes