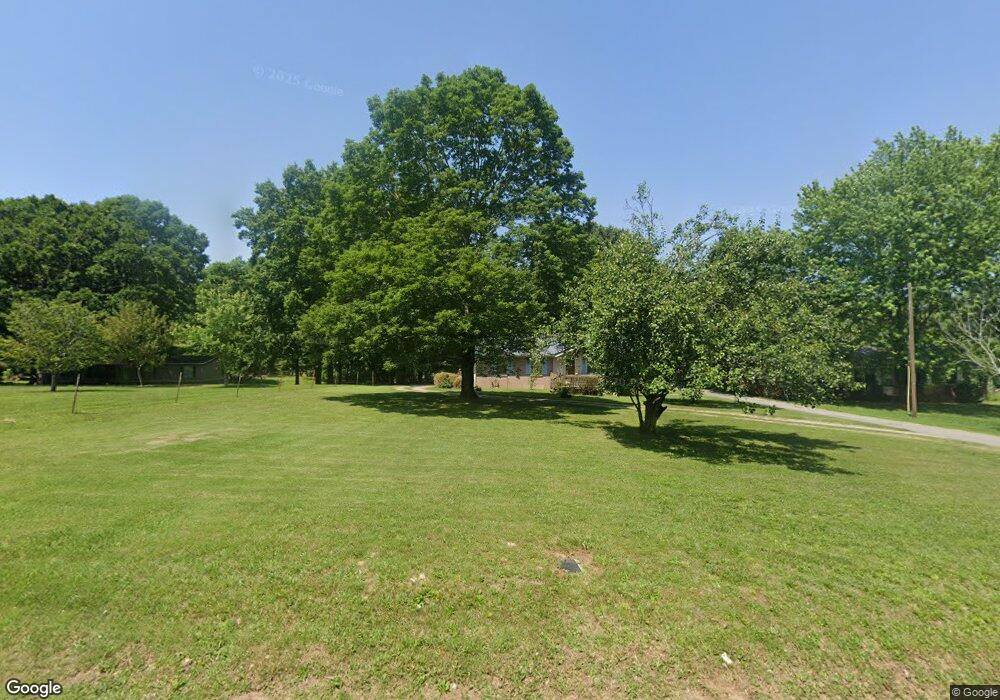
7402 Lake Rd Fairview, TN 37062
Estimated Value: $269,000 - $373,000
--
Bed
1
Bath
950
Sq Ft
$350/Sq Ft
Est. Value
About This Home
This home is located at 7402 Lake Rd, Fairview, TN 37062 and is currently estimated at $332,233, approximately $349 per square foot. 7402 Lake Rd is a home located in Williamson County with nearby schools including Westwood Elementary School, Fairview Middle School, and Fairview High School.
Ownership History
Date
Name
Owned For
Owner Type
Purchase Details
Closed on
Jun 12, 2019
Sold by
Mangrum Jacob Eli
Bought by
Mangrum Keith William and Taylor Becky Ann
Current Estimated Value
Purchase Details
Closed on
Apr 13, 2006
Sold by
Crothers Philip and Crothers Kaye
Bought by
Raymer James F and Raymer Patsy
Home Financials for this Owner
Home Financials are based on the most recent Mortgage that was taken out on this home.
Original Mortgage
$22,600
Interest Rate
6.31%
Mortgage Type
Stand Alone Second
Purchase Details
Closed on
Sep 26, 2001
Sold by
Benge John P and Benge Valerie S
Bought by
Crothers Philip and Crothers Kaye
Home Financials for this Owner
Home Financials are based on the most recent Mortgage that was taken out on this home.
Original Mortgage
$93,600
Interest Rate
8.8%
Create a Home Valuation Report for This Property
The Home Valuation Report is an in-depth analysis detailing your home's value as well as a comparison with similar homes in the area
Home Values in the Area
Average Home Value in this Area
Purchase History
| Date | Buyer | Sale Price | Title Company |
|---|---|---|---|
| Mangrum Keith William | $175,000 | None Available | |
| Mangrum Keith William | -- | None Available | |
| Raymer James F | $113,000 | Dickson Title | |
| Crothers Philip | $104,000 | -- |
Source: Public Records
Mortgage History
| Date | Status | Borrower | Loan Amount |
|---|---|---|---|
| Previous Owner | Raymer James F | $22,600 | |
| Previous Owner | Raymer James F | $90,400 | |
| Previous Owner | Crothers Philip | $93,600 |
Source: Public Records
Tax History Compared to Growth
Tax History
| Year | Tax Paid | Tax Assessment Tax Assessment Total Assessment is a certain percentage of the fair market value that is determined by local assessors to be the total taxable value of land and additions on the property. | Land | Improvement |
|---|---|---|---|---|
| 2025 | $1,172 | $61,550 | $25,625 | $35,925 |
| 2024 | $1,172 | $42,500 | $12,800 | $29,700 |
| 2023 | $1,172 | $42,500 | $12,800 | $29,700 |
| 2022 | $1,172 | $42,500 | $12,800 | $29,700 |
| 2021 | $799 | $42,500 | $12,800 | $29,700 |
| 2020 | $728 | $32,775 | $6,475 | $26,300 |
| 2019 | $728 | $32,775 | $6,475 | $26,300 |
| 2018 | $705 | $32,775 | $6,475 | $26,300 |
| 2017 | $698 | $32,775 | $6,475 | $26,300 |
| 2016 | $0 | $32,775 | $6,475 | $26,300 |
| 2015 | -- | $30,350 | $6,250 | $24,100 |
| 2014 | -- | $30,350 | $6,250 | $24,100 |
Source: Public Records
Map
Nearby Homes
- 7221 Richvale Dr
- Olivia II Plan at Richvale Estates
- Collinsville I.A Plan at Richvale Estates
- Grant II Plan at Richvale Estates
- Midland II Plan at Richvale Estates
- Holly, Front Entry Garage Plan at Richvale Estates
- Oxford Farmhouse Plan at Richvale Estates
- Stella Plan at Richvale Estates
- Holly, Side Entry Garage Plan at Richvale Estates
- Collinsville IV.A2, Side Entry Garage Plan at Richvale Estates
- Ridgeland II Plan at Richvale Estates
- Collinsville IV.A2, Front Entry Garage Plan at Richvale Estates
- 7321 Katherine Ct
- 7317 Katherine Ct
- 7323 Dutch River Cir E
- Evans Plan at Richvale Estates
- Burgess Plan at Richvale Estates
- Roan Plan at Richvale Estates
- Burgess Plan at Brush Creek
- Evans Plan at Brush Creek