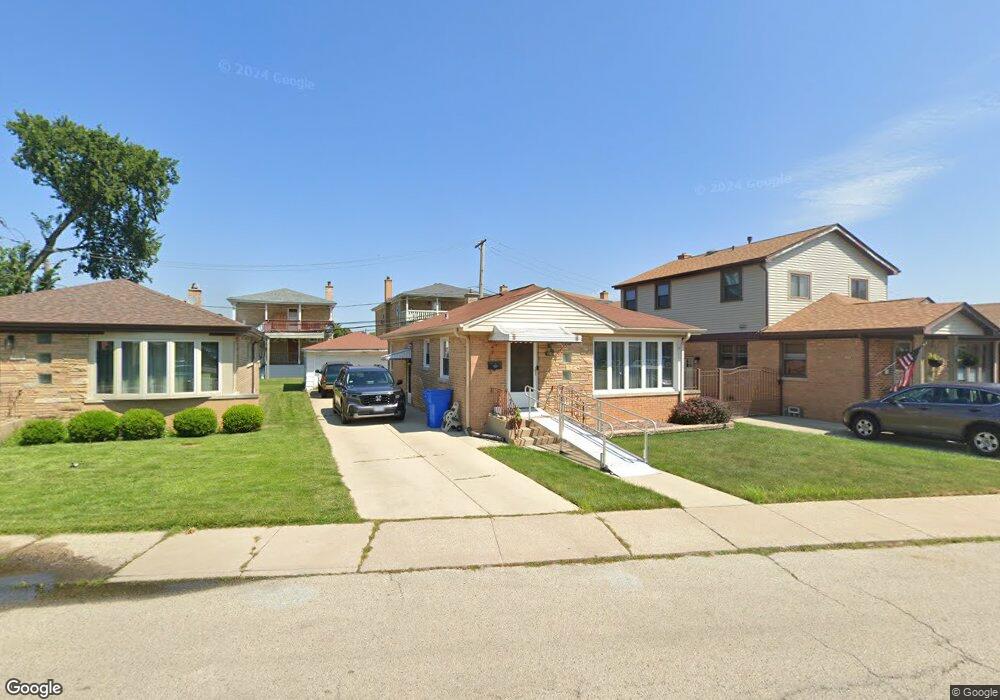
7404 W Gregory St Chicago, IL 60656
Norwood Park NeighborhoodEstimated Value: $323,000 - $409,000
2
Beds
1
Bath
1,037
Sq Ft
$363/Sq Ft
Est. Value
About This Home
This home is located at 7404 W Gregory St, Chicago, IL 60656 and is currently estimated at $376,290, approximately $362 per square foot. 7404 W Gregory St is a home located in Cook County with nearby schools including Oriole Park Elementary School, William Howard Taft High School, and Immaculate Conception School.
Ownership History
Date
Name
Owned For
Owner Type
Purchase Details
Closed on
Aug 10, 2002
Sold by
Hernandez Santos and Hernandez Maria
Bought by
Hernandez Carmen E and Hernandez Yvette
Current Estimated Value
Purchase Details
Closed on
Nov 3, 2000
Sold by
Darla Constantin and Darla Maria
Bought by
Hernandez Carmen E and Hernandez Maria
Purchase Details
Closed on
Oct 30, 1997
Sold by
Smith Marie A
Bought by
Darla Constantin M and Darla Marta A
Home Financials for this Owner
Home Financials are based on the most recent Mortgage that was taken out on this home.
Original Mortgage
$128,800
Interest Rate
7.43%
Purchase Details
Closed on
Oct 24, 1997
Sold by
Lasalle National Bank
Bought by
Marta Darla Constantin and Marta Darla
Home Financials for this Owner
Home Financials are based on the most recent Mortgage that was taken out on this home.
Original Mortgage
$128,800
Interest Rate
7.43%
Create a Home Valuation Report for This Property
The Home Valuation Report is an in-depth analysis detailing your home's value as well as a comparison with similar homes in the area
Home Values in the Area
Average Home Value in this Area
Purchase History
| Date | Buyer | Sale Price | Title Company |
|---|---|---|---|
| Hernandez Carmen E | -- | -- | |
| Hernandez Carmen E | $237,000 | Mid America Title Company | |
| Darla Constantin M | -- | Attorneys Natl Title Network | |
| Marta Darla Constantin | $161,000 | Attorneys Natl Title Network |
Source: Public Records
Mortgage History
| Date | Status | Borrower | Loan Amount |
|---|---|---|---|
| Previous Owner | Darla Constantin M | $128,800 |
Source: Public Records
Tax History Compared to Growth
Tax History
| Year | Tax Paid | Tax Assessment Tax Assessment Total Assessment is a certain percentage of the fair market value that is determined by local assessors to be the total taxable value of land and additions on the property. | Land | Improvement |
|---|---|---|---|---|
| 2024 | $5,370 | $32,000 | $10,655 | $21,345 |
| 2023 | $5,213 | $28,766 | $8,524 | $20,242 |
| 2022 | $5,213 | $28,766 | $8,524 | $20,242 |
| 2021 | $5,564 | $31,000 | $8,524 | $22,476 |
| 2020 | $4,687 | $24,143 | $5,327 | $18,816 |
| 2019 | $4,641 | $26,531 | $5,327 | $21,204 |
| 2018 | $4,562 | $26,531 | $5,327 | $21,204 |
| 2017 | $4,535 | $24,440 | $4,688 | $19,752 |
| 2016 | $4,395 | $24,440 | $4,688 | $19,752 |
| 2015 | $4,234 | $25,727 | $4,688 | $21,039 |
| 2014 | $3,844 | $23,285 | $4,262 | $19,023 |
| 2013 | $3,757 | $23,285 | $4,262 | $19,023 |
Source: Public Records
Map
Nearby Homes
- 7229 W Higgins Ave Unit 602
- 7226 W Summerdale Ave
- 5345 N Neva Ave
- 5818 N Octavia Ave
- 7127 W Summerdale Ave
- 5605 N Overhill Ave
- 5205 N Osceola Ave
- 5526 N Nordica Ave
- 6959 W Higgins Ave Unit 1S
- 5704 N Ozark Ave
- 7754 W Higgins Rd Unit J
- 7635 W Foster Ave
- 7766 W Higgins Rd Unit E
- 5056 N Mont Clare Ave
- 5975 N Odell Ave Unit 4G
- 5975 N Odell Ave Unit 4F
- 5949 N Odell Ave Unit 2E
- 7817 W Balmoral Ave
- 7744 W Thorndale Ave
- 5048 N Nottingham Ave
- 7400 W Gregory St
- 7410 W Gregory St
- 7344 W Gregory St
- 7359 W Higgins Ave
- 7359 W Higgins Ave
- 7359 W Higgins Ave Unit 1
- 7340 W Gregory St
- 7353 W Higgins Ave
- 7349 W Higgins Ave
- 7401 W Gregory St
- 7420 W Gregory St
- 7407 W Gregory St
- 7345 W Higgins Ave Unit 1
- 7345 W Higgins Ave Unit 2
- 7345 W Higgins Ave
- 7415 W Gregory St
- 7336 W Gregory St
- 7424 W Gregory St
- 5561 N Osceola Ave
- 7341 W Higgins Ave