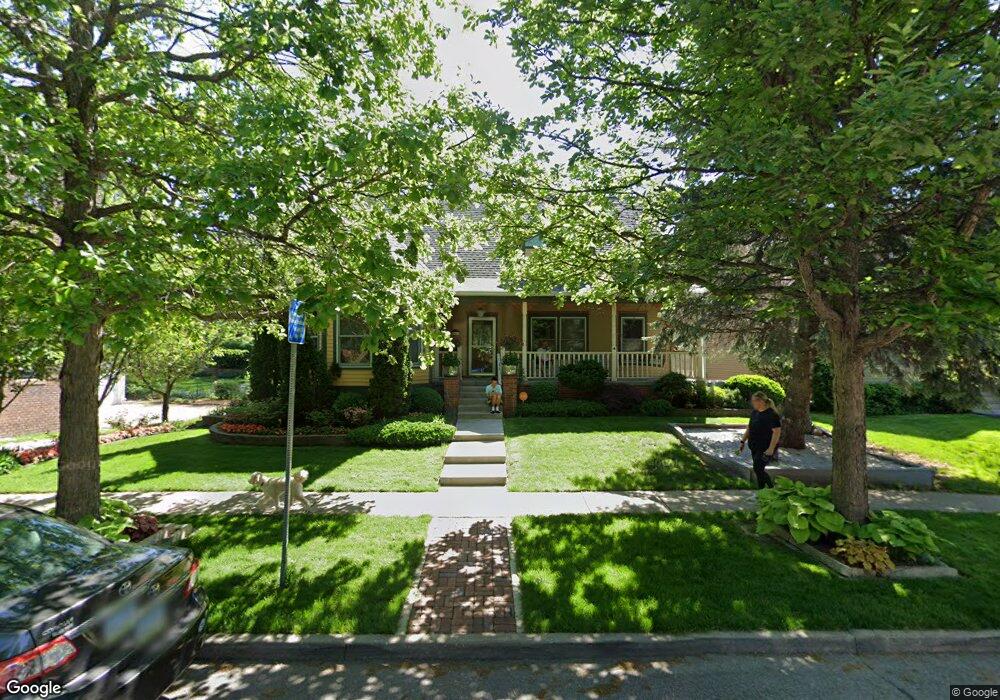
741 16th St Des Moines, IA 50314
Sherman Hill NeighborhoodEstimated Value: $398,733 - $490,000
4
Beds
3
Baths
2,198
Sq Ft
$204/Sq Ft
Est. Value
About This Home
This home is located at 741 16th St, Des Moines, IA 50314 and is currently estimated at $448,933, approximately $204 per square foot. 741 16th St is a home located in Polk County with nearby schools including Callanan Middle School and Roosevelt High School.
Ownership History
Date
Name
Owned For
Owner Type
Purchase Details
Closed on
Oct 11, 2011
Sold by
United States Of America
Bought by
Han Dat Hung
Current Estimated Value
Home Financials for this Owner
Home Financials are based on the most recent Mortgage that was taken out on this home.
Original Mortgage
$214,423
Outstanding Balance
$144,072
Interest Rate
3.87%
Mortgage Type
FHA
Estimated Equity
$304,861
Purchase Details
Closed on
May 19, 2009
Sold by
Terry Susan J and Campney Jo Anne
Bought by
Dteueno Phyllon and Dleueno Maila
Purchase Details
Closed on
Sep 18, 2000
Sold by
Guinn Chester L
Bought by
Terry Susan J and Campney Jo Anne
Home Financials for this Owner
Home Financials are based on the most recent Mortgage that was taken out on this home.
Original Mortgage
$70,000
Interest Rate
8.05%
Create a Home Valuation Report for This Property
The Home Valuation Report is an in-depth analysis detailing your home's value as well as a comparison with similar homes in the area
Home Values in the Area
Average Home Value in this Area
Purchase History
| Date | Buyer | Sale Price | Title Company |
|---|---|---|---|
| Han Dat Hung | -- | None Available | |
| Dteueno Phyllon | $379,500 | None Available | |
| Terry Susan J | $239,500 | -- |
Source: Public Records
Mortgage History
| Date | Status | Borrower | Loan Amount |
|---|---|---|---|
| Open | Han Dat Hung | $214,423 | |
| Previous Owner | Terry Susan J | $70,000 |
Source: Public Records
Tax History Compared to Growth
Tax History
| Year | Tax Paid | Tax Assessment Tax Assessment Total Assessment is a certain percentage of the fair market value that is determined by local assessors to be the total taxable value of land and additions on the property. | Land | Improvement |
|---|---|---|---|---|
| 2025 | $7,852 | $435,300 | $62,000 | $373,300 |
| 2024 | $7,852 | $396,000 | $55,000 | $341,000 |
| 2023 | $7,332 | $396,000 | $55,000 | $341,000 |
| 2022 | $7,274 | $309,500 | $44,600 | $264,900 |
| 2021 | $7,048 | $309,500 | $44,600 | $264,900 |
| 2020 | $7,302 | $281,800 | $40,500 | $241,300 |
| 2019 | $7,032 | $281,800 | $40,500 | $241,300 |
| 2018 | $6,952 | $262,100 | $36,500 | $225,600 |
| 2017 | $6,576 | $262,100 | $36,500 | $225,600 |
| 2016 | $6,402 | $244,200 | $33,500 | $210,700 |
| 2015 | $6,402 | $244,200 | $33,500 | $210,700 |
| 2014 | $5,966 | $234,700 | $31,800 | $202,900 |
Source: Public Records
Map
Nearby Homes