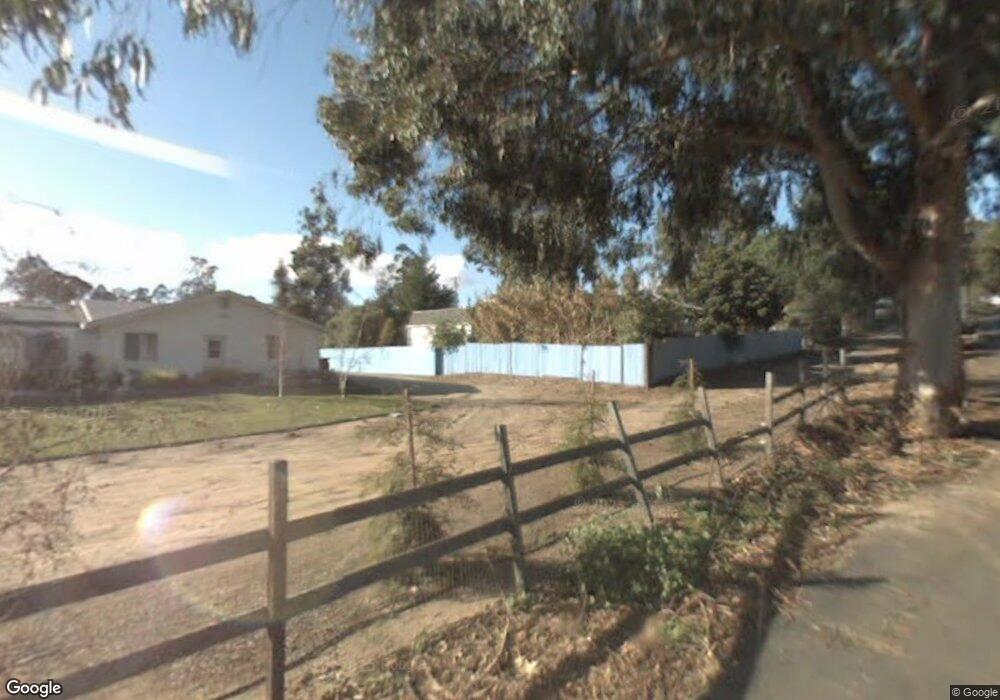
741 Pomeroy Rd Nipomo, CA 93444
Estimated Value: $879,981 - $1,292,000
3
Beds
2
Baths
1,844
Sq Ft
$552/Sq Ft
Est. Value
About This Home
This home is located at 741 Pomeroy Rd, Nipomo, CA 93444 and is currently estimated at $1,016,995, approximately $551 per square foot. 741 Pomeroy Rd is a home located in San Luis Obispo County with nearby schools including Dana Elementary School, Mesa Middle School, and Nipomo High School.
Ownership History
Date
Name
Owned For
Owner Type
Purchase Details
Closed on
Sep 15, 2022
Sold by
Camille Nordwall Jan
Bought by
Nordwall Family Trust
Current Estimated Value
Purchase Details
Closed on
Feb 1, 2022
Sold by
Camille Nordwall Jan
Bought by
Nordwall Family Trust
Purchase Details
Closed on
Jan 4, 1996
Sold by
Hud
Bought by
Nordwall Grant S and Nordwall Jan Camille
Home Financials for this Owner
Home Financials are based on the most recent Mortgage that was taken out on this home.
Original Mortgage
$135,700
Interest Rate
7.36%
Mortgage Type
FHA
Purchase Details
Closed on
Apr 27, 1995
Sold by
Uvalle Frank R and Uvalle Dolores M
Bought by
Hud
Create a Home Valuation Report for This Property
The Home Valuation Report is an in-depth analysis detailing your home's value as well as a comparison with similar homes in the area
Home Values in the Area
Average Home Value in this Area
Purchase History
| Date | Buyer | Sale Price | Title Company |
|---|---|---|---|
| Nordwall Family Trust | -- | -- | |
| Nordwall Family Trust | -- | Law Office Of Doreen R Curtze | |
| Nordwall Grant S | $91,500 | First American Title Ins Co | |
| Hud | $152,862 | Fidelity National Title |
Source: Public Records
Mortgage History
| Date | Status | Borrower | Loan Amount |
|---|---|---|---|
| Previous Owner | Nordwall Grant S | $135,700 |
Source: Public Records
Tax History
| Year | Tax Paid | Tax Assessment Tax Assessment Total Assessment is a certain percentage of the fair market value that is determined by local assessors to be the total taxable value of land and additions on the property. | Land | Improvement |
|---|---|---|---|---|
| 2025 | $2,563 | $249,154 | $149,498 | $99,656 |
| 2024 | $2,533 | $244,269 | $146,567 | $97,702 |
| 2023 | $2,533 | $239,481 | $143,694 | $95,787 |
| 2022 | $2,495 | $234,786 | $140,877 | $93,909 |
| 2021 | $2,491 | $230,183 | $138,115 | $92,068 |
| 2020 | $2,462 | $227,823 | $136,699 | $91,124 |
| 2019 | $2,447 | $223,357 | $134,019 | $89,338 |
| 2018 | $2,418 | $218,979 | $131,392 | $87,587 |
| 2017 | $2,373 | $214,686 | $128,816 | $85,870 |
| 2016 | $2,238 | $210,478 | $126,291 | $84,187 |
| 2015 | $2,206 | $207,317 | $124,394 | $82,923 |
| 2014 | $2,124 | $203,257 | $121,958 | $81,299 |
Source: Public Records
Map
Nearby Homes
- 680 Sweet Donna Place
- 760 Black Oak Ln
- 1089 Olympic Way
- 12 Oakglen S
- 770 & 772 Beverly
- 182 172 E Chestnut
- 940 Calle Fresa
- 745 Inga Rd
- 219 Lema Dr
- 1093 Camino Caballo
- 850 Primrose Ln
- 228 Chaparral Ln
- 778 Primrose Ln
- 1060 Dawn Rd
- 1160 Oakmont Place Unit 1
- 719 W Tefft St
- 250 Via Promesa
- 270 S Tejas Place
- 680 Hill St
- 340 N Las Flores Dr
- 731 Pomeroy Rd
- 925 Olympic Way
- 935 Olympic Way
- 745 Pomeroy Rd
- 733 Pomeroy Rd
- 915 Nine Oaks Ln
- 915 Olympic Way
- 945 Olympic Way
- 732 Pomeroy Rd
- 752 Pomeroy Rd
- 725 Whimbrel Ct
- 949 Olympic Way
- 750 Pomeroy Rd
- 925 Nine Oaks Ln
- 720 Whimbrel Ct
- 764 Pomeroy Rd
- 926 Olympic Way
- 920 Olympic Way
- 930 Olympic Way
- 714 Whimbrel Ct
Your Personal Tour Guide
Ask me questions while you tour the home.