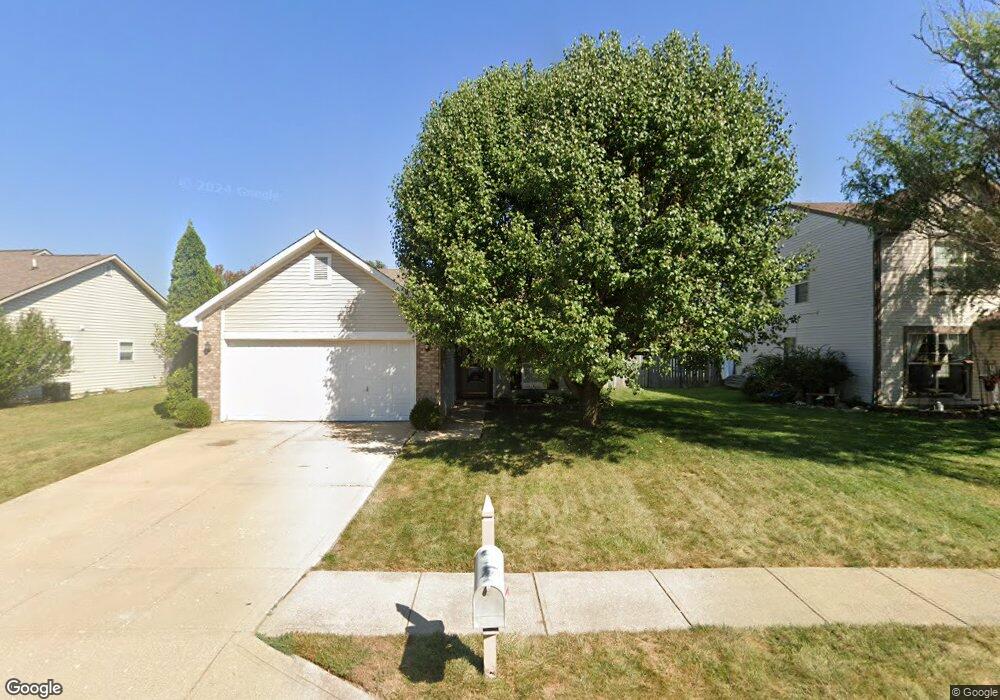
742 Apple Ln Brownsburg, IN 46112
Estimated Value: $249,000 - $272,000
3
Beds
2
Baths
1,196
Sq Ft
$217/Sq Ft
Est. Value
About This Home
This home is located at 742 Apple Ln, Brownsburg, IN 46112 and is currently estimated at $259,429, approximately $216 per square foot. 742 Apple Ln is a home located in Hendricks County with nearby schools including Lincoln Elementary, Brownsburg East Middle School, and Brownsburg High School.
Ownership History
Date
Name
Owned For
Owner Type
Purchase Details
Closed on
Jul 13, 2010
Sold by
Secretary Of Housing & Urban Development
Bought by
Camacho Rodriguez Kelly
Current Estimated Value
Home Financials for this Owner
Home Financials are based on the most recent Mortgage that was taken out on this home.
Original Mortgage
$67,316
Outstanding Balance
$45,901
Interest Rate
5.25%
Mortgage Type
FHA
Estimated Equity
$213,528
Purchase Details
Closed on
Feb 1, 2010
Sold by
Gmac Mortgage Llc
Bought by
Secretary Of Housing & Urban Development
Purchase Details
Closed on
Jan 21, 2010
Sold by
Wilson Kristine E
Bought by
Gmac Mortgage Llc
Purchase Details
Closed on
Oct 18, 2005
Sold by
Lehn Anthony R and Lehn Katherine M
Bought by
Wilson Kristine E
Home Financials for this Owner
Home Financials are based on the most recent Mortgage that was taken out on this home.
Original Mortgage
$1,130,752
Interest Rate
5.89%
Mortgage Type
FHA
Create a Home Valuation Report for This Property
The Home Valuation Report is an in-depth analysis detailing your home's value as well as a comparison with similar homes in the area
Home Values in the Area
Average Home Value in this Area
Purchase History
| Date | Buyer | Sale Price | Title Company |
|---|---|---|---|
| Camacho Rodriguez Kelly | -- | None Available | |
| Secretary Of Housing & Urban Development | $138,067 | None Available | |
| Gmac Mortgage Llc | $138,067 | None Available | |
| Wilson Kristine E | -- | Ltic |
Source: Public Records
Mortgage History
| Date | Status | Borrower | Loan Amount |
|---|---|---|---|
| Open | Camacho Rodriguez Kelly | $67,316 | |
| Previous Owner | Wilson Kristine E | $1,130,752 |
Source: Public Records
Tax History Compared to Growth
Tax History
| Year | Tax Paid | Tax Assessment Tax Assessment Total Assessment is a certain percentage of the fair market value that is determined by local assessors to be the total taxable value of land and additions on the property. | Land | Improvement |
|---|---|---|---|---|
| 2024 | $2,038 | $203,800 | $49,900 | $153,900 |
| 2023 | $1,907 | $190,700 | $45,800 | $144,900 |
| 2022 | $1,639 | $163,900 | $42,400 | $121,500 |
| 2021 | $1,395 | $139,500 | $38,600 | $100,900 |
| 2020 | $1,332 | $133,200 | $38,600 | $94,600 |
| 2019 | $1,193 | $120,900 | $36,700 | $84,200 |
| 2018 | $1,153 | $118,200 | $36,700 | $81,500 |
| 2017 | $1,024 | $110,000 | $34,000 | $76,000 |
| 2016 | $987 | $107,900 | $34,000 | $73,900 |
| 2014 | $948 | $103,900 | $31,200 | $72,700 |
Source: Public Records
Map
Nearby Homes
- 725 Hawthorne Ln
- 1208 Brittany Cir Unit A
- 1208 Whittington Dr
- 1202 Whittington Dr
- 1415 Beaumont Cir
- Wexford Plan at Forest Hill
- 1505 Arbor Springs Dr
- 1113 River Ridge Dr
- 1284 Summer Ridge Ln
- 1280 Summer Ridge Ln
- 1327 Blue Ridge Ln
- 961 Pine Ridge Way
- 7215 Barrett Dr
- 7089 Symphony Dr
- 7166 Rhapsody Way
- 7242 Barrett Dr
- 203 Woodside Ct
- 7252 Barrett Dr
- 35 Northridge Ct
- 543 N Odell St