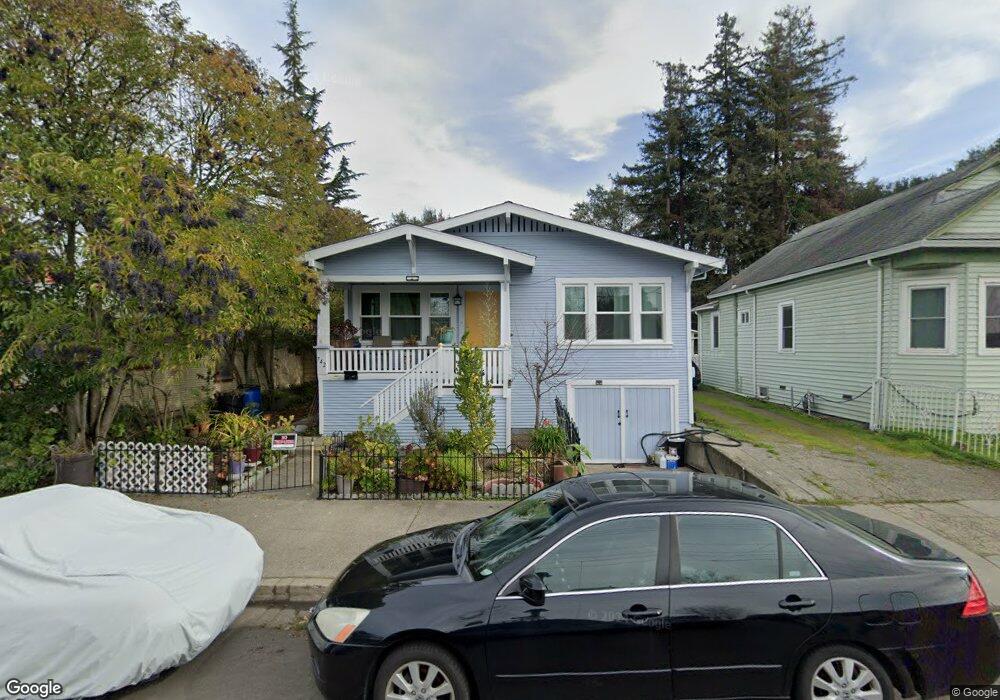
742 Davis St Santa Rosa, CA 95401
Historic Railroad Square NeighborhoodEstimated Value: $543,000 - $576,000
3
Beds
1
Bath
1,119
Sq Ft
$502/Sq Ft
Est. Value
About This Home
This home is located at 742 Davis St, Santa Rosa, CA 95401 and is currently estimated at $561,443, approximately $501 per square foot. 742 Davis St is a home located in Sonoma County with nearby schools including Steele Lane Elementary School, Santa Rosa Middle School, and Santa Rosa High School.
Ownership History
Date
Name
Owned For
Owner Type
Purchase Details
Closed on
Oct 3, 2024
Sold by
Cena Kimberly
Bought by
Bailey Family Trust and Bailey
Current Estimated Value
Purchase Details
Closed on
Oct 8, 2012
Sold by
Cena Donald Michael
Bought by
Cena Donald Michael and Cena Kimberly
Purchase Details
Closed on
Aug 8, 2001
Sold by
Young Fred A and Young Carol A
Bought by
Cena Donald Michael
Home Financials for this Owner
Home Financials are based on the most recent Mortgage that was taken out on this home.
Original Mortgage
$193,250
Interest Rate
7.1%
Purchase Details
Closed on
May 21, 1999
Sold by
Young Carol A and Young Fred
Bought by
Young Fred A and Young Carol A
Purchase Details
Closed on
May 15, 1998
Sold by
Young Carol A
Bought by
Young Fred A and Young Carol A
Create a Home Valuation Report for This Property
The Home Valuation Report is an in-depth analysis detailing your home's value as well as a comparison with similar homes in the area
Home Values in the Area
Average Home Value in this Area
Purchase History
| Date | Buyer | Sale Price | Title Company |
|---|---|---|---|
| Bailey Family Trust | $532,000 | Fidelity National Title | |
| Cena Donald Michael | -- | None Available | |
| Cena Donald Michael | $242,500 | North American Title Co | |
| Young Fred A | -- | Chicago Title Co | |
| Young Fred | $6,500 | Chicago Title Co | |
| Young Fred A | -- | -- | |
| Young Carol A | -- | -- |
Source: Public Records
Mortgage History
| Date | Status | Borrower | Loan Amount |
|---|---|---|---|
| Previous Owner | Cena Donald Michael | $193,250 | |
| Closed | Cena Donald Michael | $25,000 |
Source: Public Records
Tax History Compared to Growth
Tax History
| Year | Tax Paid | Tax Assessment Tax Assessment Total Assessment is a certain percentage of the fair market value that is determined by local assessors to be the total taxable value of land and additions on the property. | Land | Improvement |
|---|---|---|---|---|
| 2025 | $3,973 | $532,000 | $213,000 | $319,000 |
| 2024 | $3,973 | $351,209 | $130,342 | $220,867 |
| 2023 | $3,973 | $344,324 | $127,787 | $216,537 |
| 2022 | $3,668 | $337,574 | $125,282 | $212,292 |
| 2021 | $3,622 | $330,956 | $122,826 | $208,130 |
| 2020 | $3,613 | $327,563 | $121,567 | $205,996 |
| 2019 | $3,593 | $321,141 | $119,184 | $201,957 |
| 2018 | $3,572 | $314,846 | $116,848 | $197,998 |
| 2017 | $3,507 | $308,673 | $114,557 | $194,116 |
| 2016 | $3,476 | $302,621 | $112,311 | $190,310 |
| 2015 | $3,371 | $298,076 | $110,624 | $187,452 |
| 2014 | $2,368 | $220,000 | $82,000 | $138,000 |
Source: Public Records
Map
Nearby Homes
- 743 Davis St
- 432 8th St
- 100 W 8th St
- 223 Decker St
- 1117 Glenn St
- 714 Mendocino Ave
- 542 College Ave
- 303 Hewett St
- 740 Mendocino Ave
- 705 College Ave
- 810 7th St Unit 23
- 930 Kingwood St
- 595 N Dutton Ave
- 164 N Dutton Ave Unit 7
- 415 Duncan St
- 919 Kingwood St
- 722 Orchard St
- 726 Orchard St
- 904 Renee Ct
- 209 Decoe St