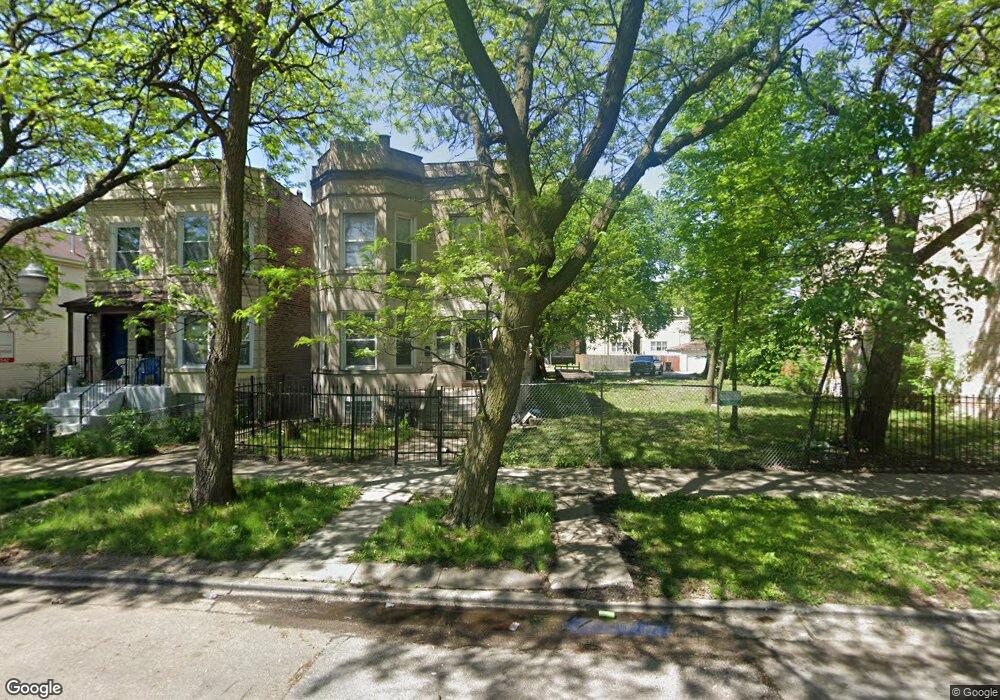
742 S Kenneth Ave Unit 2 Chicago, IL 60624
Garfield Park NeighborhoodEstimated Value: $280,000 - $394,580
5
Beds
2
Baths
2,416
Sq Ft
$140/Sq Ft
Est. Value
About This Home
This home is located at 742 S Kenneth Ave Unit 2, Chicago, IL 60624 and is currently estimated at $337,290, approximately $139 per square foot. 742 S Kenneth Ave Unit 2 is a home located in Cook County with nearby schools including Sumner Elementary Math & Sci Community Academy.
Ownership History
Date
Name
Owned For
Owner Type
Purchase Details
Closed on
Oct 12, 2023
Sold by
Yarbrough Karen A
Bought by
Cook County Land Bk Authority
Current Estimated Value
Purchase Details
Closed on
Nov 20, 2006
Sold by
Collins Joe L and Collins Annie L
Bought by
Robertson Terrance
Home Financials for this Owner
Home Financials are based on the most recent Mortgage that was taken out on this home.
Original Mortgage
$294,500
Interest Rate
9.6%
Mortgage Type
Commercial
Purchase Details
Closed on
Apr 29, 2005
Sold by
Budicek Michael
Bought by
Collins Joe L and Collins Annie L
Home Financials for this Owner
Home Financials are based on the most recent Mortgage that was taken out on this home.
Original Mortgage
$171,000
Interest Rate
6.37%
Mortgage Type
Commercial
Purchase Details
Closed on
Jun 4, 2003
Sold by
Schiller Inc
Bought by
Budicek Michael
Purchase Details
Closed on
Apr 14, 2003
Sold by
Orr David D
Bought by
Schiller Inc
Create a Home Valuation Report for This Property
The Home Valuation Report is an in-depth analysis detailing your home's value as well as a comparison with similar homes in the area
Home Values in the Area
Average Home Value in this Area
Purchase History
| Date | Buyer | Sale Price | Title Company |
|---|---|---|---|
| Cook County Land Bk Authority | -- | None Listed On Document | |
| Robertson Terrance | $310,000 | Lawyers | |
| Collins Joe L | $190,000 | Lawyers | |
| Budicek Michael | $55,000 | Git | |
| Budicek Michael | $55,000 | Git | |
| Schiller Inc | -- | -- | |
| Schiller Inc | -- | -- |
Source: Public Records
Mortgage History
| Date | Status | Borrower | Loan Amount |
|---|---|---|---|
| Previous Owner | Robertson Terrance | $294,500 | |
| Previous Owner | Collins Joe L | $171,000 |
Source: Public Records
Tax History Compared to Growth
Tax History
| Year | Tax Paid | Tax Assessment Tax Assessment Total Assessment is a certain percentage of the fair market value that is determined by local assessors to be the total taxable value of land and additions on the property. | Land | Improvement |
|---|---|---|---|---|
| 2024 | $877 | $5,111 | $5,111 | -- |
| 2023 | $855 | $4,142 | $4,142 | -- |
| 2022 | $855 | $4,142 | $4,142 | $0 |
| 2021 | $835 | $4,141 | $4,141 | $0 |
| 2020 | $926 | $4,141 | $4,141 | $0 |
| 2019 | $835 | $4,141 | $4,141 | $0 |
| 2018 | $821 | $4,141 | $4,141 | $0 |
| 2017 | $4,544 | $21,035 | $3,701 | $17,334 |
| 2016 | $4,213 | $21,035 | $3,701 | $17,334 |
| 2015 | $3,855 | $21,035 | $3,701 | $17,334 |
| 2014 | $3,686 | $19,869 | $3,525 | $16,344 |
| 2013 | $3,614 | $19,869 | $3,525 | $16,344 |
Source: Public Records
Map
Nearby Homes
- 760 S Kostner Ave
- 812 S Kilbourn Ave
- 814 S Kilbourn Ave
- 4357 W Flournoy St
- 4317 W Flournoy St
- 4424 W Congress Pkwy
- 421 S Kilbourn Ave
- 4212 W 5th Ave
- 4730 W Arthington St
- 338 S Kostner Ave
- 801 S Kedvale Ave
- 4741 W Harrison St
- 4745 W Harrison St
- 4459 W Jackson Blvd
- 1245 S Kolin Ave
- 738 S Karlov Ave
- 814 S Karlov Ave
- 4721 W Van Buren St
- 4536 W Jackson Blvd
- 4340 W Jackson Blvd
- 742 S Kenneth Ave
- 744 S Kenneth Ave
- 744 S Kenneth Ave
- 740 S Kenneth Ave
- 748 S Kenneth Ave
- 738 S Kenneth Ave Unit 2
- 736 S Kenneth Ave
- 756 S Kenneth Ave
- 756 S Kenneth Ave
- 732 S Kenneth Ave
- 754 S Kenneth Ave
- 758 S Kenneth Ave
- 741 S Kenneth Ave
- 743 S Kenneth Ave
- 747 S Kenneth Ave
- 749 S Kenneth Ave Unit 2
- 739 S Kenneth Ave
- 741 S Kilbourn Ave Unit 2
- 741 S Kilbourn Ave
- 762 S Kenneth Ave