
Seller's Agent in 2025
David Leung
SoCal Homes, Inc.
(310) 904-8016
2 in this area
25 Total Sales

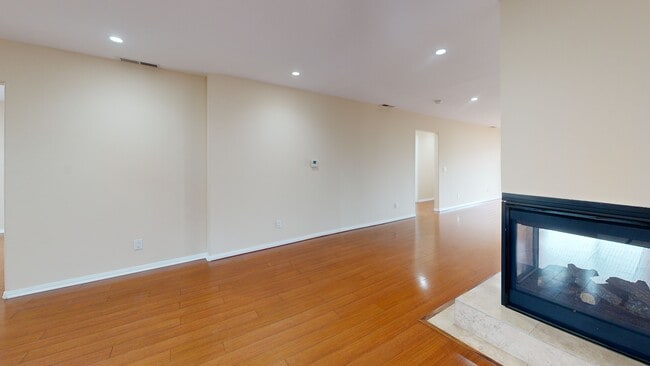

Affordable Value — 7428 Wilbur Avenue, Reseda, CA 91335 — • 3 Bedrooms • 3 Bathrooms • Bonus Studio • 2,321 Sq Ft • 7,750 Sq Ft Lot • Welcome to a spacious, updated home designed for families and professionals seeking comfort, flexibility, and unbeatable value. Rebuilt in 2015 and refreshed in 2025, this move-in-ready residence offers high-end finishes and versatile living spaces—all at an accessible price point. — What Makes It Special:
• 3 large bedrooms plus a bonus studio—perfect for remote work, guests, or creative space
• Gourmet kitchen with custom cabinetry, premium stone counters & stainless-steel appliances
• Elegant living room with modern fireplace and natural light
• Three full bathrooms for convenience and privacy
• Quality craftsmanship and thoughtful updates throughout — Outdoor Living:
• Expansive backyard ideal for entertaining, gardening, or future ADU/pool
• Mature trees offer shade and tranquility
• Flat lot with room to grow — Prime Reseda Location:
• Minutes from parks, schools, shopping & freeway access
• Family-friendly neighborhood with strong community appeal
Last Agent to Sell the Property
SoCal Homes, Inc. Brokerage Phone: 310-904-8016 License #01923098 Listed on: 10/14/2025
| Date | Type | Sale Price | Title Company |
|---|---|---|---|
| Grant Deed | $875,000 | Wfg National Title | |
| Trustee Deed | $290,500 | None Available | |
| Grant Deed | $589,000 | Gateway Title Company | |
| Grant Deed | $325,000 | Gateway Title Company | |
| Interfamily Deed Transfer | -- | -- | |
| Interfamily Deed Transfer | -- | -- |
| Date | Status | Loan Amount | Loan Type |
|---|---|---|---|
| Open | $787,500 | New Conventional | |
| Previous Owner | $452,000 | Fannie Mae Freddie Mac | |
| Previous Owner | $260,000 | Purchase Money Mortgage | |
| Closed | $65,000 | No Value Available | |
| Closed | $113,000 | No Value Available |
| Date | Event | Price | List to Sale | Price per Sq Ft |
|---|---|---|---|---|
| 12/02/2025 12/02/25 | Sold | $875,000 | -2.8% | $377 / Sq Ft |
| 10/14/2025 10/14/25 | For Sale | $899,999 | -- | $388 / Sq Ft |
| Year | Tax Paid | Tax Assessment Tax Assessment Total Assessment is a certain percentage of the fair market value that is determined by local assessors to be the total taxable value of land and additions on the property. | Land | Improvement |
|---|---|---|---|---|
| 2025 | $4,003 | $304,622 | $193,618 | $111,004 |
| 2024 | $4,003 | $298,650 | $189,822 | $108,828 |
| 2023 | $3,932 | $292,795 | $186,100 | $106,695 |
| 2022 | $3,759 | $287,054 | $182,451 | $104,603 |
| 2021 | $3,703 | $281,426 | $178,874 | $102,552 |
| 2019 | $3,599 | $273,080 | $173,569 | $99,511 |
| 2018 | $3,488 | $267,726 | $170,166 | $97,560 |
| 2016 | $3,314 | $257,332 | $163,559 | $93,773 |
| 2015 | $3,269 | $253,468 | $161,103 | $92,365 |
| 2014 | $3,288 | $305,364 | $203,226 | $102,138 |
Seller's Agent in 2025
David Leung
SoCal Homes, Inc.
(310) 904-8016
2 in this area
25 Total Sales
K
Buyer's Agent in 2025
Kristine Barsumyan
KT Realty Group, Inc.
(818) 392-0226
2 in this area
29 Total Sales
Source: California Regional Multiple Listing Service (CRMLS)
MLS Number: SB25239698
APN: 2118-001-024
Disclaimer: Certain information contained herein is derived from information provided by parties other than Homes.com. All information provided is deemed reliable, but is not guaranteed to be accurate and should be independently verified.
![]() The multiple listing data appearing on this website, or contained in reports produced therefrom, is owned and copyrighted by California Regional Multiple Listing Service, Inc. ("CRMLS") and is protected by all applicable copyright laws. Information provided is for viewer's personal, non-commercial use and may not be used for any purpose other than to identify prospective properties the viewer may be interested in purchasing. All listing data, including but not limited to square footage and lot size is believed to be accurate, but the listing Agent, listing Broker and CRMLS and its affiliates do not warrant or guarantee such accuracy. The viewer should independently verify the listed data prior to making any decisions based on such information by personal inspection and/or contacting a real estate professional.
The multiple listing data appearing on this website, or contained in reports produced therefrom, is owned and copyrighted by California Regional Multiple Listing Service, Inc. ("CRMLS") and is protected by all applicable copyright laws. Information provided is for viewer's personal, non-commercial use and may not be used for any purpose other than to identify prospective properties the viewer may be interested in purchasing. All listing data, including but not limited to square footage and lot size is believed to be accurate, but the listing Agent, listing Broker and CRMLS and its affiliates do not warrant or guarantee such accuracy. The viewer should independently verify the listed data prior to making any decisions based on such information by personal inspection and/or contacting a real estate professional.
Based on information from California Regional Multiple Listing Service, Inc. and /or other sources. All data, including all measurements and calculations of area, is obtained from various sources and has not been, and will not be, verified by broker or MLS. All information should be independently reviewed and verified for accuracy. Properties may or may not be listed by the office/agent presenting the information
Ask me questions while you tour the home.