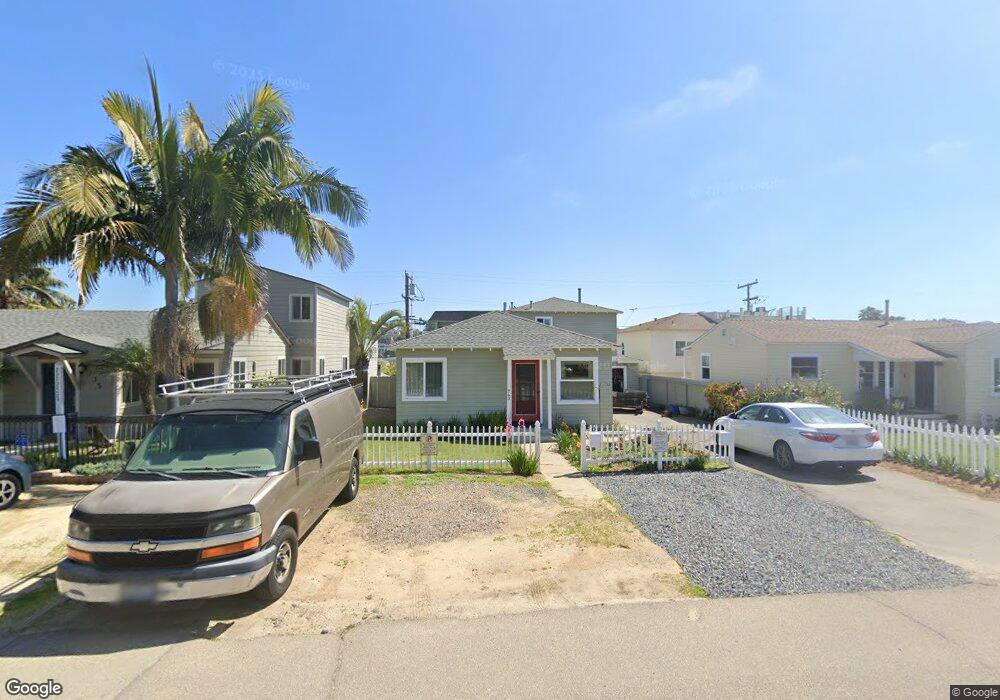
743 4th St Encinitas, CA 92024
Central Encinitas NeighborhoodEstimated Value: $1,596,194 - $5,097,000
3
Beds
2
Baths
1,090
Sq Ft
$2,771/Sq Ft
Est. Value
About This Home
This home is located at 743 4th St, Encinitas, CA 92024 and is currently estimated at $3,020,549, approximately $2,771 per square foot. 743 4th St is a home located in San Diego County with nearby schools including Paul Ecke-Central Elementary, Diegueno Middle School, and La Costa Canyon High School.
Ownership History
Date
Name
Owned For
Owner Type
Purchase Details
Closed on
Jun 4, 2020
Sold by
Torp Ronald
Bought by
Torp Ronald and Torp Karen
Current Estimated Value
Purchase Details
Closed on
Nov 6, 2013
Sold by
Torp Ronald A and Torp Karen L
Bought by
Torp Ronald A and Torp Karen L
Home Financials for this Owner
Home Financials are based on the most recent Mortgage that was taken out on this home.
Original Mortgage
$250,000
Interest Rate
4.18%
Mortgage Type
Credit Line Revolving
Purchase Details
Closed on
Oct 23, 2013
Sold by
Torp Ronald A
Bought by
Torp Ronald A and Torp Karen L
Home Financials for this Owner
Home Financials are based on the most recent Mortgage that was taken out on this home.
Original Mortgage
$250,000
Interest Rate
4.18%
Mortgage Type
Credit Line Revolving
Purchase Details
Closed on
Oct 23, 2009
Sold by
Phillips Terri
Bought by
Torp Ronald A
Create a Home Valuation Report for This Property
The Home Valuation Report is an in-depth analysis detailing your home's value as well as a comparison with similar homes in the area
Home Values in the Area
Average Home Value in this Area
Purchase History
| Date | Buyer | Sale Price | Title Company |
|---|---|---|---|
| Torp Ronald | -- | None Available | |
| Torp Ronald | -- | None Available | |
| Torp Ronald A | -- | Lawyers Title Co | |
| Torp Ronald A | -- | None Available | |
| Torp Ronald A | -- | None Available |
Source: Public Records
Mortgage History
| Date | Status | Borrower | Loan Amount |
|---|---|---|---|
| Closed | Torp Ronald A | $250,000 |
Source: Public Records
Tax History
| Year | Tax Paid | Tax Assessment Tax Assessment Total Assessment is a certain percentage of the fair market value that is determined by local assessors to be the total taxable value of land and additions on the property. | Land | Improvement |
|---|---|---|---|---|
| 2025 | $1,921 | $126,105 | $44,092 | $82,013 |
| 2024 | $1,921 | $123,633 | $43,228 | $80,405 |
| 2023 | $1,889 | $121,210 | $42,381 | $78,829 |
| 2022 | $1,752 | $118,834 | $41,550 | $77,284 |
| 2021 | $1,816 | $116,505 | $40,736 | $75,769 |
| 2020 | $1,967 | $115,312 | $40,319 | $74,993 |
| 2019 | $1,940 | $113,052 | $39,529 | $73,523 |
| 2018 | $1,967 | $110,836 | $38,754 | $72,082 |
| 2017 | $191 | $108,664 | $37,995 | $70,669 |
| 2016 | $1,961 | $106,534 | $37,250 | $69,284 |
| 2015 | $1,963 | $104,935 | $36,691 | $68,244 |
| 2014 | $1,835 | $102,881 | $35,973 | $66,908 |
Source: Public Records
Map
Nearby Homes
- 806 4th St
- 922 Sealane Dr Unit B
- 937 3rd St
- 687 S Coast Highway 101 Unit 223
- 538 4th St
- 231 5th St
- 823 Stratford Dr
- 90 N Coast Highway 101 Unit 310
- 90 N Coast Highway 101
- 201 4th St Unit A & B
- 554 & 556 Stratford Dr
- 100 5th St
- 1180 Devonshire Dr
- 407 Requeza St Unit E9
- 233 Mangano Cir
- 200 Neptune Ave Unit 2
- 215 N Vulcan Ave
- 103 Mangano Cir
- 545 Quail Pointe Ln
- 1009 Arcadia Rd
Your Personal Tour Guide
Ask me questions while you tour the home.