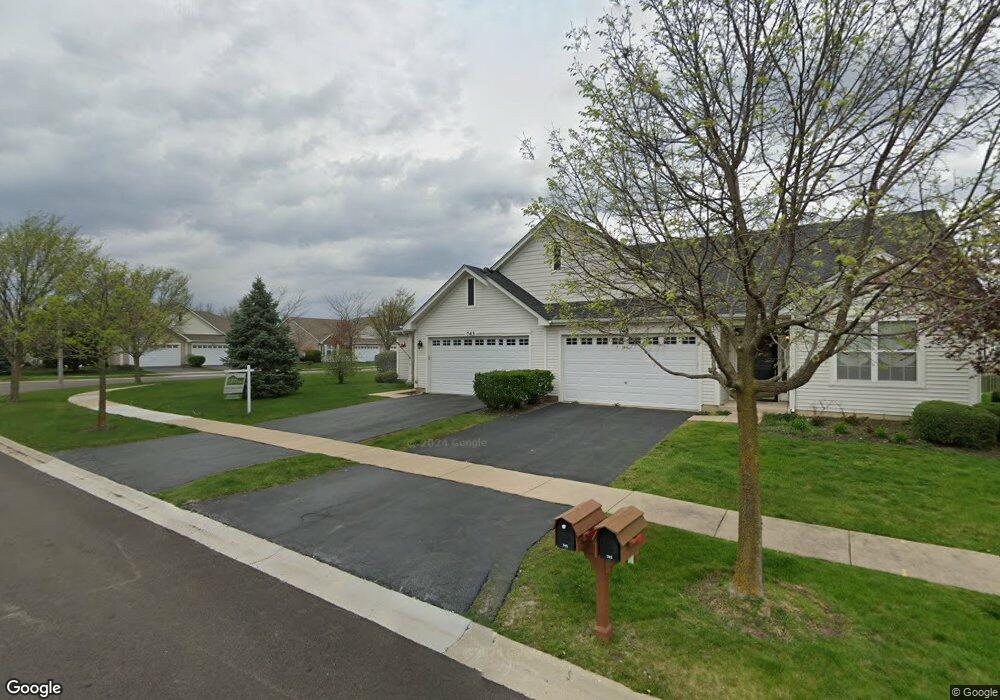
743 Bellevue Cir Unit 2 Oswego, IL 60543
North Oswego NeighborhoodEstimated Value: $304,000 - $327,000
2
Beds
2
Baths
1,313
Sq Ft
$239/Sq Ft
Est. Value
About This Home
This home is located at 743 Bellevue Cir Unit 2, Oswego, IL 60543 and is currently estimated at $314,452, approximately $239 per square foot. 743 Bellevue Cir Unit 2 is a home located in Kendall County with nearby schools including Churchill Elementary School, Plank Junior High School, and Oswego East High School.
Ownership History
Date
Name
Owned For
Owner Type
Purchase Details
Closed on
Jun 28, 2024
Sold by
Chandrapala Gonbadu L and Liyanage Carmeline S
Bought by
Gonbadu L Chandrapala And Carmeline S Liyanag and Chandrapala
Current Estimated Value
Purchase Details
Closed on
Apr 22, 2024
Sold by
Rowe Gerald and Rowe Mary
Bought by
Liyanage Carmeline and Chandrapala Gonbadu
Purchase Details
Closed on
Feb 16, 2023
Sold by
Somora Family Trust
Bought by
Rowe Gerald and Rowe Mary
Purchase Details
Closed on
Oct 26, 2015
Sold by
Somora Michael R and Somora Jo Ann M
Bought by
The Somora Family Trust and Somora Jo Ann M
Purchase Details
Closed on
Nov 9, 2007
Sold by
Hovstone Properties Illinois Llc
Bought by
Somora Michael R and Somora Jo Ann
Create a Home Valuation Report for This Property
The Home Valuation Report is an in-depth analysis detailing your home's value as well as a comparison with similar homes in the area
Home Values in the Area
Average Home Value in this Area
Purchase History
| Date | Buyer | Sale Price | Title Company |
|---|---|---|---|
| Gonbadu L Chandrapala And Carmeline S Liyanag | -- | None Listed On Document | |
| Liyanage Carmeline | $300,000 | None Listed On Document | |
| Rowe Gerald | $267,500 | None Listed On Document | |
| The Somora Family Trust | -- | Attorney | |
| Somora Michael R | $195,000 | Chicago Title Insurance Co |
Source: Public Records
Tax History Compared to Growth
Tax History
| Year | Tax Paid | Tax Assessment Tax Assessment Total Assessment is a certain percentage of the fair market value that is determined by local assessors to be the total taxable value of land and additions on the property. | Land | Improvement |
|---|---|---|---|---|
| 2024 | $5,593 | $80,497 | $14,283 | $66,214 |
| 2023 | $3,969 | $69,997 | $12,420 | $57,577 |
| 2022 | $3,969 | $63,634 | $11,291 | $52,343 |
| 2021 | $4,113 | $62,612 | $11,110 | $51,502 |
| 2020 | $4,153 | $61,992 | $11,000 | $50,992 |
| 2019 | $4,219 | $61,992 | $11,000 | $50,992 |
| 2018 | $4,450 | $59,625 | $17,575 | $42,050 |
| 2017 | $4,506 | $54,954 | $16,198 | $38,756 |
| 2016 | $4,274 | $52,090 | $15,354 | $36,736 |
| 2015 | $4,264 | $50,086 | $14,763 | $35,323 |
| 2014 | -- | $48,159 | $14,195 | $33,964 |
| 2013 | -- | $48,645 | $14,338 | $34,307 |
Source: Public Records
Map
Nearby Homes
- 712 Bohannon Cir
- 0000 Fifth St
- 786 Bohannon Cir
- 790 Bohannon Cir
- 22 Alex Ct Unit 1
- 502 Vernon Dr
- 524 Majestic Ln
- 700 N Sparkle Ct
- 104 Waterbury Cir
- 34 Waterbury Cir Unit 1
- 2071 Wiesbrook Dr
- 1468 Vintage Dr
- 1459 Vintage Dr
- BELLAMY Plan at Sonoma Trails - Single Family Homes
- Bradley Plan at Sonoma Trails - Single Family Homes
- Haven Plan at Sonoma Trails - Single Family Homes
- HENLEY Plan at Sonoma Trails - Single Family Homes
- EMERSON Plan at Sonoma Trails - Single Family Homes
- Sloan Plan at Sonoma Trails - Single Family Homes
- COVENTRY Plan at Sonoma Trails - Single Family Homes
- 743 Bellevue Cir
- 745 Bellevue Cir
- 747 Bellevue Cir
- 718 Bellevue Cir
- 718 Bellevue Cir Unit 2
- 716 Bellevue Cir
- 714 Bellevue Cir
- 714 Bellevue Cir Unit 2
- 749 Bellevue Cir
- 744 Bellevue Cir
- 746 Bellevue Cir
- 735 Bellevue Cir
- 742 Bellevue Cir
- 733 Bellevue Cir
- 712 Bellevue Cir
- 748 Bellevue Cir
- 751 Bellevue Cir
- 731 Bellevue Cir
- 737 Bellevue Cir
- 740 Bellevue Cir