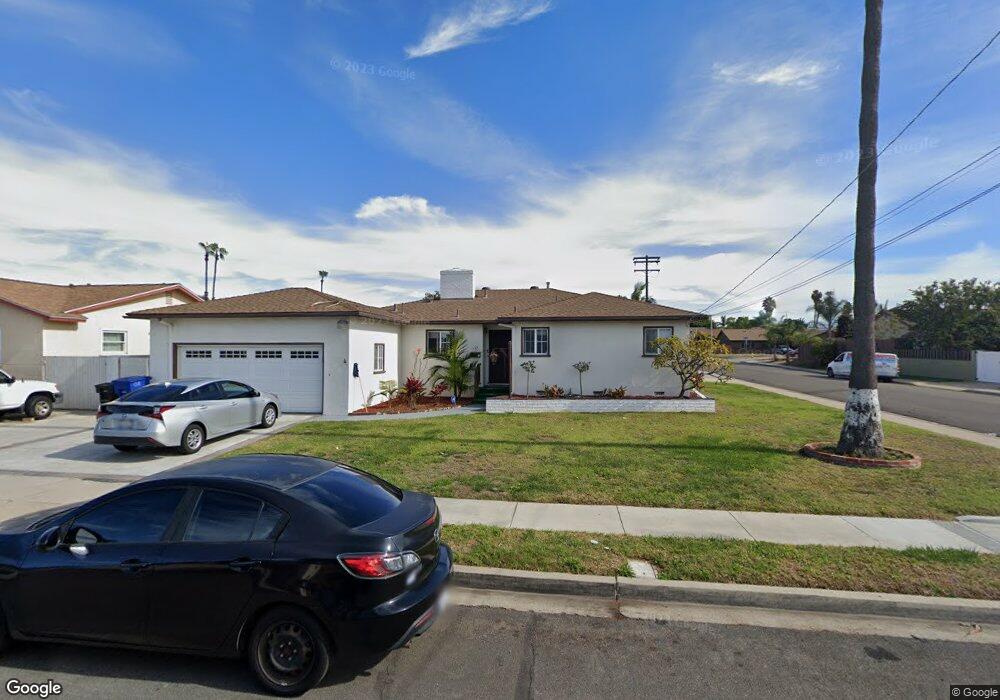
743 Brightwood Ave Chula Vista, CA 91910
Downtown Chula Vista NeighborhoodEstimated Value: $766,134 - $836,000
3
Beds
2
Baths
1,396
Sq Ft
$575/Sq Ft
Est. Value
About This Home
This home is located at 743 Brightwood Ave, Chula Vista, CA 91910 and is currently estimated at $802,784, approximately $575 per square foot. 743 Brightwood Ave is a home located in San Diego County with nearby schools including Lilian J. Rice Elementary School, Chula Vista Middle School, and Chula Vista High School.
Ownership History
Date
Name
Owned For
Owner Type
Purchase Details
Closed on
May 3, 2017
Sold by
Valderrama Felipe M and Valderrama Julieta A
Bought by
Valderrama Felipe M and Valderrama Julieta A
Current Estimated Value
Purchase Details
Closed on
Sep 17, 2007
Sold by
Valderrama Felipe M and Valderrama Julieta A
Bought by
Valderrama Felipe M and Valderrama Julieta A
Purchase Details
Closed on
Dec 7, 1993
Sold by
Valderrama Felipe M and Valderrama Julieta A
Bought by
Valderrama Felipe M and Valderrama Julieta A
Create a Home Valuation Report for This Property
The Home Valuation Report is an in-depth analysis detailing your home's value as well as a comparison with similar homes in the area
Home Values in the Area
Average Home Value in this Area
Purchase History
| Date | Buyer | Sale Price | Title Company |
|---|---|---|---|
| Valderrama Felipe M | -- | None Available | |
| Valderrama Felipe M | -- | None Available | |
| Valderrama Felipe M | -- | -- |
Source: Public Records
Tax History Compared to Growth
Tax History
| Year | Tax Paid | Tax Assessment Tax Assessment Total Assessment is a certain percentage of the fair market value that is determined by local assessors to be the total taxable value of land and additions on the property. | Land | Improvement |
|---|---|---|---|---|
| 2025 | $6,032 | $523,396 | $398,238 | $125,158 |
| 2024 | $6,032 | $513,134 | $390,430 | $122,704 |
| 2023 | $5,950 | $503,074 | $382,775 | $120,299 |
| 2022 | $5,779 | $493,211 | $375,270 | $117,941 |
| 2021 | $5,646 | $483,541 | $367,912 | $115,629 |
| 2020 | $5,511 | $478,584 | $364,140 | $114,444 |
| 2019 | $919 | $78,011 | $25,656 | $52,355 |
| 2018 | $825 | $76,482 | $25,153 | $51,329 |
| 2017 | $806 | $74,983 | $24,660 | $50,323 |
| 2016 | $785 | $73,514 | $24,177 | $49,337 |
| 2015 | $773 | $72,410 | $23,814 | $48,596 |
| 2014 | $760 | $70,993 | $23,348 | $47,645 |
Source: Public Records
Map
Nearby Homes
- 658 Cedar Ave
- 580 4th Ave
- 898 Date Ave
- 516 L St
- Plan 6 at Citrus Bay - The Towns
- Plan 4 at Citrus Bay - The Towns
- Plan 2 at Citrus Bay - The Towns
- Plan 5 at Citrus Bay - The Towns
- Plan 3 at Citrus Bay - The Towns
- Plan 1 at Citrus Bay - The Towns
- 550 L St
- Plan1 at Citrus Bay - The Courts
- Plan 2 at Citrus Bay - The Courts
- Plan 3 at Citrus Bay - The Courts
- 383 Mankato St Unit 6
- 766 Madison Ave Unit A B
- 786 Madison Ave
- 685 Jefferson Ave
- 622 I St
- 479 Arizona St
- 737 Brightwood Ave
- 441 Kearney St
- 751 Brightwood Ave
- 731 Brightwood Ave
- 437 Kearney St
- 752 Fig Ave
- 738 Brightwood Ave
- 442 James Ct
- 757 Brightwood Ave
- 752 Brightwood Ave
- 732 Brightwood Ave
- 725 Brightwood Ave
- 433 Kearney St
- 446 James Ct
- 758 Fig Ave
- 758 Brightwood Ave
- 438 James Ct
- 763 Brightwood Ave
- 745 Elder Ave
- 726 Brightwood Ave