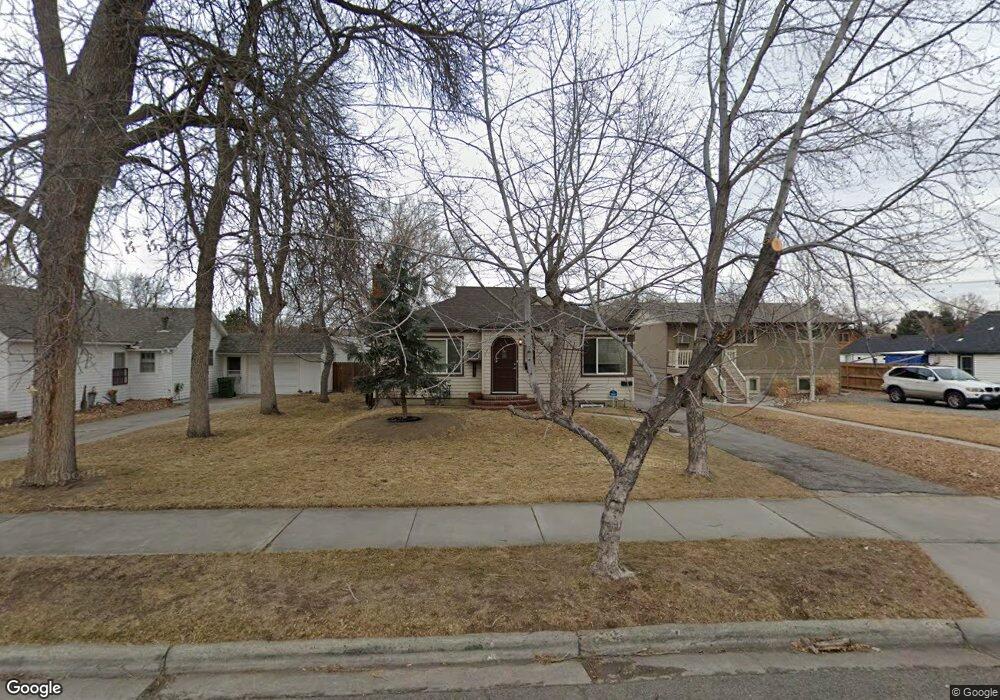
743 Cook Ave Billings, MT 59101
East Central Billings NeighborhoodEstimated Value: $270,000 - $336,720
4
Beds
2
Baths
2,108
Sq Ft
$143/Sq Ft
Est. Value
About This Home
This home is located at 743 Cook Ave, Billings, MT 59101 and is currently estimated at $302,430, approximately $143 per square foot. 743 Cook Ave is a home located in Yellowstone County with nearby schools including Washington School, Lewis & Clark Junior High School, and Billings Senior High School.
Ownership History
Date
Name
Owned For
Owner Type
Purchase Details
Closed on
Nov 27, 2013
Sold by
Kelly Monika C
Bought by
Vanwagoner Riger B and Van Wagoner Marie L
Current Estimated Value
Home Financials for this Owner
Home Financials are based on the most recent Mortgage that was taken out on this home.
Original Mortgage
$136,000
Outstanding Balance
$100,965
Interest Rate
4.04%
Mortgage Type
New Conventional
Estimated Equity
$201,465
Purchase Details
Closed on
Apr 11, 2005
Sold by
Kelly Monika
Bought by
Kelly Monika C
Home Financials for this Owner
Home Financials are based on the most recent Mortgage that was taken out on this home.
Original Mortgage
$95,400
Interest Rate
5.77%
Mortgage Type
New Conventional
Create a Home Valuation Report for This Property
The Home Valuation Report is an in-depth analysis detailing your home's value as well as a comparison with similar homes in the area
Home Values in the Area
Average Home Value in this Area
Purchase History
| Date | Buyer | Sale Price | Title Company |
|---|---|---|---|
| Vanwagoner Riger B | -- | None Available | |
| Kelly Monika C | -- | None Available |
Source: Public Records
Mortgage History
| Date | Status | Borrower | Loan Amount |
|---|---|---|---|
| Open | Vanwagoner Riger B | $136,000 | |
| Previous Owner | Kelly Monika C | $95,400 |
Source: Public Records
Tax History Compared to Growth
Tax History
| Year | Tax Paid | Tax Assessment Tax Assessment Total Assessment is a certain percentage of the fair market value that is determined by local assessors to be the total taxable value of land and additions on the property. | Land | Improvement |
|---|---|---|---|---|
| 2025 | $2,668 | $307,400 | $37,400 | $270,000 |
| 2024 | $2,668 | $273,200 | $37,300 | $235,900 |
| 2023 | $2,672 | $273,200 | $37,300 | $235,900 |
| 2022 | $2,314 | $206,400 | $34,400 | $172,000 |
| 2021 | $2,205 | $206,400 | $0 | $0 |
| 2020 | $2,333 | $205,400 | $0 | $0 |
| 2019 | $2,226 | $205,400 | $0 | $0 |
| 2018 | $2,047 | $183,000 | $0 | $0 |
| 2017 | $1,694 | $183,000 | $0 | $0 |
| 2016 | $1,862 | $171,000 | $0 | $0 |
| 2015 | $1,817 | $171,000 | $0 | $0 |
| 2014 | $1,644 | $81,725 | $0 | $0 |
Source: Public Records
Map
Nearby Homes