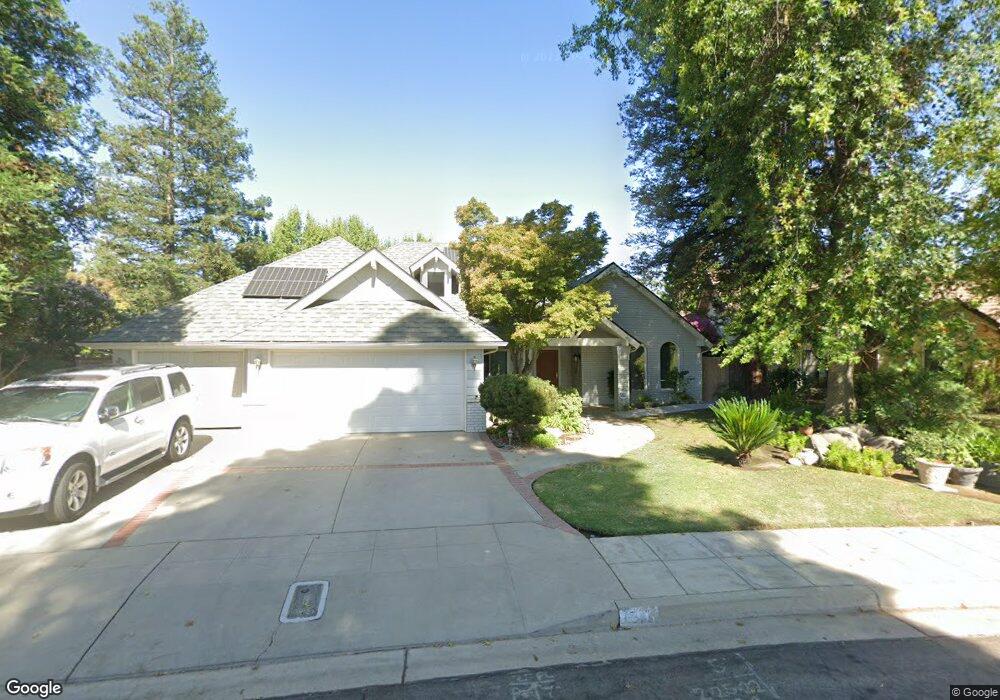
743 E Wood Duck Cir Fresno, CA 93730
Woodward Park NeighborhoodEstimated Value: $737,000 - $828,000
4
Beds
3
Baths
2,708
Sq Ft
$291/Sq Ft
Est. Value
About This Home
This home is located at 743 E Wood Duck Cir, Fresno, CA 93730 and is currently estimated at $789,294, approximately $291 per square foot. 743 E Wood Duck Cir is a home located in Fresno County with nearby schools including Valley Oak Elementary School, Kastner Intermediate School, and Clovis West High School.
Ownership History
Date
Name
Owned For
Owner Type
Purchase Details
Closed on
Jun 29, 2011
Sold by
Middleton Allen H
Bought by
Villafafila Pierre Paul and Farinelli Catherine L
Current Estimated Value
Purchase Details
Closed on
Jan 28, 1999
Sold by
Middleton Allen H
Bought by
Middleton Allen H
Home Financials for this Owner
Home Financials are based on the most recent Mortgage that was taken out on this home.
Original Mortgage
$269,000
Interest Rate
6.73%
Purchase Details
Closed on
Jul 27, 1994
Sold by
Blaufuss Katherine J
Bought by
Middleton Allen H and Middleton Rita E
Home Financials for this Owner
Home Financials are based on the most recent Mortgage that was taken out on this home.
Original Mortgage
$280,000
Interest Rate
8.65%
Create a Home Valuation Report for This Property
The Home Valuation Report is an in-depth analysis detailing your home's value as well as a comparison with similar homes in the area
Home Values in the Area
Average Home Value in this Area
Purchase History
| Date | Buyer | Sale Price | Title Company |
|---|---|---|---|
| Villafafila Pierre Paul | $535,000 | Fidelity National Title Co | |
| Middleton Allen H | -- | North American Title Co | |
| Middleton Allen H | $380,000 | Chicago Title Company |
Source: Public Records
Mortgage History
| Date | Status | Borrower | Loan Amount |
|---|---|---|---|
| Previous Owner | Middleton Allen H | $269,000 | |
| Previous Owner | Middleton Allen H | $280,000 |
Source: Public Records
Tax History Compared to Growth
Tax History
| Year | Tax Paid | Tax Assessment Tax Assessment Total Assessment is a certain percentage of the fair market value that is determined by local assessors to be the total taxable value of land and additions on the property. | Land | Improvement |
|---|---|---|---|---|
| 2025 | $7,896 | $671,979 | $201,591 | $470,388 |
| 2023 | $7,743 | $645,887 | $193,764 | $452,123 |
| 2022 | $7,637 | $633,223 | $189,965 | $443,258 |
| 2021 | $7,422 | $620,808 | $186,241 | $434,567 |
| 2020 | $7,392 | $614,444 | $184,332 | $430,112 |
| 2019 | $7,246 | $602,397 | $180,718 | $421,679 |
| 2018 | $7,086 | $590,586 | $177,175 | $413,411 |
| 2017 | $6,963 | $579,006 | $173,701 | $405,305 |
| 2016 | $6,728 | $567,654 | $170,296 | $397,358 |
| 2015 | $6,623 | $559,128 | $167,738 | $391,390 |
| 2014 | $6,499 | $548,177 | $164,453 | $383,724 |
Source: Public Records
Map
Nearby Homes
- 761 E Wood Duck Cir
- 776 E Wood Duck Cir
- 534 E Mariners Cir
- 640 E Pintail Cir
- 10250 N Quail Run Dr
- 10130 N Heather Dr
- 843 E Country View Cir
- 609 E Teal Cir
- 851 E Country View Cir
- 656 E Teal Cir
- 1039 E Oakmont Ave
- 9938 N Canyon Creek Ln
- 876 E Sutton Dr
- 1082 E Oakmont Ave
- 1127 E Pinehurst Ave
- 1138 E Pinehurst Ave
- 10717 N Bunkerhill Dr
- 1055 E Hogan Ave
- 787 E Buckhill Rd
- 1138 E Royal Dornoch Ave
- 741 E Wood Duck Cir
- 745 E Wood Duck Cir
- 749 E Wood Duck Cir
- 737 E Wood Duck Cir
- 746 E Wood Duck Cir
- 740 E Wood Duck Cir
- 751 E Wood Duck Cir
- 735 E Wood Duck Cir
- 750 E Wood Duck Cir
- 734 E Wood Duck Cir
- 753 E Wood Duck Cir
- 752 E Wood Duck Cir
- 733 E Wood Duck Cir
- 768 E Wood Duck Cir
- 730 E Wood Duck Cir
- 756 E Wood Duck Cir
- 766 E Wood Duck Cir
- 729 E Wood Duck Cir
- 757 E Wood Duck Cir
- 728 E Wood Duck Cir