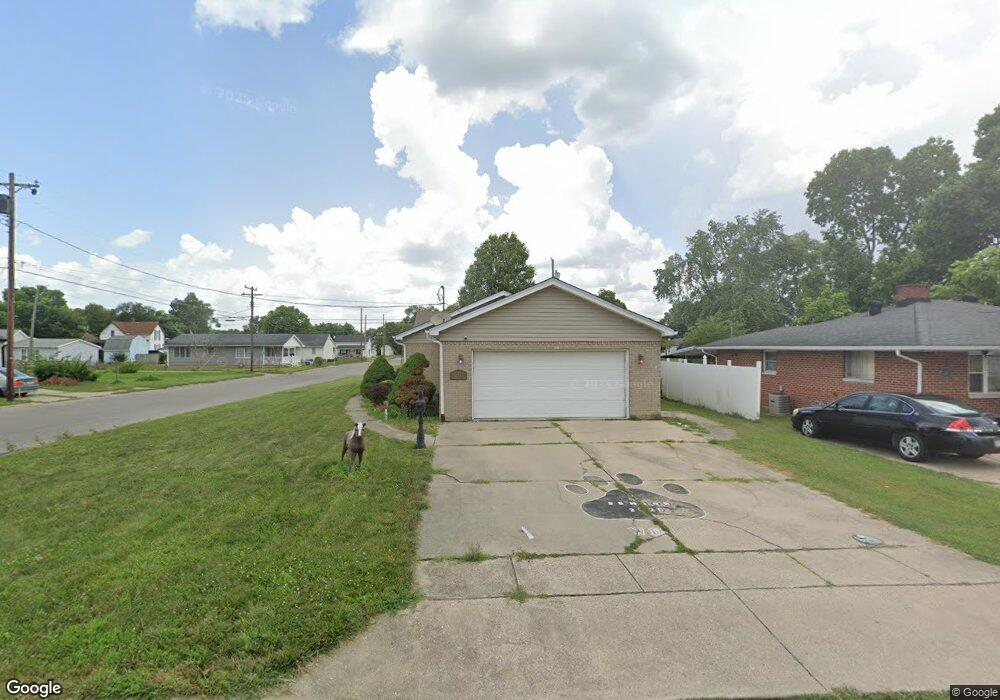
743 Forest Ave Franklin, OH 45005
Estimated Value: $185,845 - $218,000
3
Beds
2
Baths
1,522
Sq Ft
$133/Sq Ft
Est. Value
About This Home
This home is located at 743 Forest Ave, Franklin, OH 45005 and is currently estimated at $202,211, approximately $132 per square foot. 743 Forest Ave is a home located in Warren County with nearby schools including Franklin High School.
Ownership History
Date
Name
Owned For
Owner Type
Purchase Details
Closed on
Aug 4, 2025
Sold by
Lewis Freda R and Bruggeman Freda R
Bought by
Bruggeman Freda R and Bruggeman James
Current Estimated Value
Purchase Details
Closed on
Jun 4, 2020
Sold by
Estate Of Rachel Marie Hensley
Bought by
Lewis Freda R
Purchase Details
Closed on
Sep 17, 2008
Sold by
Hensley Henry L and Hensley Rachel M
Bought by
Hensley Henry L and Hensley Rachel M
Purchase Details
Closed on
Oct 4, 2006
Sold by
Va
Bought by
Hensley Henry L and Hensley Rachel M
Purchase Details
Closed on
Nov 18, 2005
Sold by
Napier Rickey E and Household Realty Corp
Bought by
Va
Purchase Details
Closed on
Jan 25, 2000
Sold by
Fisher Alice M
Bought by
Napier Rickey E
Home Financials for this Owner
Home Financials are based on the most recent Mortgage that was taken out on this home.
Original Mortgage
$66,300
Interest Rate
7.81%
Mortgage Type
VA
Create a Home Valuation Report for This Property
The Home Valuation Report is an in-depth analysis detailing your home's value as well as a comparison with similar homes in the area
Home Values in the Area
Average Home Value in this Area
Purchase History
| Date | Buyer | Sale Price | Title Company |
|---|---|---|---|
| Bruggeman Freda R | -- | None Listed On Document | |
| Lewis Freda R | -- | None Available | |
| Hensley Henry L | -- | Attorney | |
| Hensley Henry L | -- | First Title | |
| Va | $80,000 | None Available | |
| Napier Rickey E | $65,000 | -- |
Source: Public Records
Mortgage History
| Date | Status | Borrower | Loan Amount |
|---|---|---|---|
| Previous Owner | Napier Rickey E | $66,300 |
Source: Public Records
Tax History
| Year | Tax Paid | Tax Assessment Tax Assessment Total Assessment is a certain percentage of the fair market value that is determined by local assessors to be the total taxable value of land and additions on the property. | Land | Improvement |
|---|---|---|---|---|
| 2025 | $2,464 | $51,610 | $2,420 | $49,190 |
| 2024 | $2,464 | $51,610 | $2,420 | $49,190 |
| 2023 | $2,163 | $40,040 | $2,331 | $37,709 |
| 2022 | $2,083 | $40,040 | $2,331 | $37,709 |
| 2021 | $1,976 | $40,040 | $2,331 | $37,709 |
| 2020 | $1,899 | $33,929 | $1,974 | $31,955 |
| 2019 | $1,296 | $33,929 | $1,974 | $31,955 |
| 2018 | $1,298 | $33,929 | $1,974 | $31,955 |
| 2017 | $1,387 | $33,397 | $1,981 | $31,416 |
| 2016 | $1,413 | $33,397 | $1,981 | $31,416 |
| 2015 | $1,413 | $33,397 | $1,981 | $31,416 |
| 2014 | $1,448 | $33,400 | $1,980 | $31,420 |
| 2013 | $1,203 | $37,000 | $2,190 | $34,810 |
Source: Public Records
Map
Nearby Homes
Your Personal Tour Guide
Ask me questions while you tour the home.