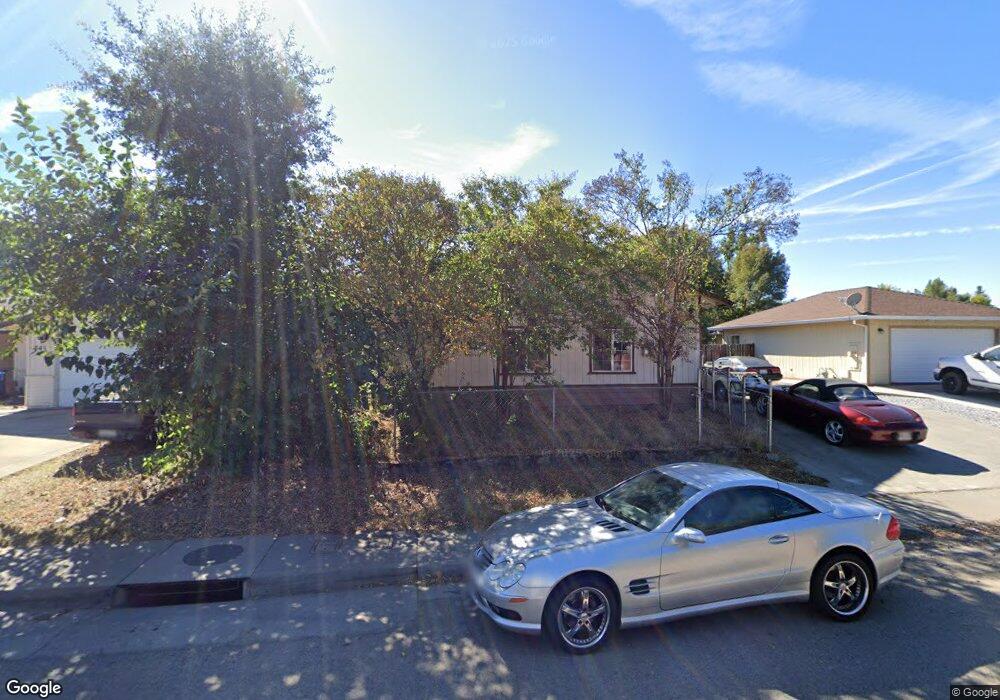
743 Lay Ave Red Bluff, CA 96080
Estimated Value: $308,000 - $325,000
3
Beds
2
Baths
1,632
Sq Ft
$195/Sq Ft
Est. Value
About This Home
This home is located at 743 Lay Ave, Red Bluff, CA 96080 and is currently estimated at $317,772, approximately $194 per square foot. 743 Lay Ave is a home located in Tehama County with nearby schools including Jackson Heights Elementary School, Vista Preparatory Academy, and Red Bluff High School.
Ownership History
Date
Name
Owned For
Owner Type
Purchase Details
Closed on
Jun 28, 2021
Sold by
Blackketter Michael A and Blackketter Janet L
Bought by
Blackketter Michael A and Blackketter Janet L
Current Estimated Value
Purchase Details
Closed on
Dec 1, 2010
Sold by
Colbert Jeweldeen
Bought by
Blackketter Mike
Purchase Details
Closed on
Jun 16, 2009
Sold by
Colbert Jeweldeen and Blackketter Janet
Bought by
Colbert Jeweldeen and Blackketter Mike
Purchase Details
Closed on
Jan 7, 2003
Sold by
Rust Terrance A and Rust Beverly Johnson
Bought by
Colbert Jewelden
Create a Home Valuation Report for This Property
The Home Valuation Report is an in-depth analysis detailing your home's value as well as a comparison with similar homes in the area
Purchase History
| Date | Buyer | Sale Price | Title Company |
|---|---|---|---|
| Blackketter Michael A | -- | None Available | |
| Blackketter Michael A | -- | None Available | |
| Blackketter Mike | -- | None Available | |
| Colbert Jeweldeen | -- | None Available | |
| Colbert Jewelden | $26,000 | Chicago Title Co |
Source: Public Records
Tax History
| Year | Tax Paid | Tax Assessment Tax Assessment Total Assessment is a certain percentage of the fair market value that is determined by local assessors to be the total taxable value of land and additions on the property. | Land | Improvement |
|---|---|---|---|---|
| 2025 | $2,078 | $204,332 | $44,833 | $159,499 |
| 2023 | $2,043 | $196,399 | $43,093 | $153,306 |
| 2022 | $2,029 | $192,549 | $42,249 | $150,300 |
| 2021 | $1,948 | $188,774 | $41,421 | $147,353 |
| 2020 | $1,988 | $186,840 | $40,997 | $145,843 |
| 2019 | $2,001 | $183,178 | $40,194 | $142,984 |
| 2018 | $1,850 | $179,587 | $39,406 | $140,181 |
| 2017 | $1,867 | $176,067 | $38,634 | $137,433 |
| 2016 | $1,743 | $172,616 | $37,877 | $134,739 |
| 2015 | $1,716 | $170,025 | $37,309 | $132,716 |
| 2014 | $1,692 | $166,696 | $36,579 | $130,117 |
Source: Public Records
Map
Nearby Homes
- 660 Villa Dr
- 224 S Jackson St
- 425 S Jackson St
- 406 S Jackson St
- 821 Locust St
- 910 Aloha St
- 845 Olive St
- 1160 Orange St
- 180 S Main St
- 1270 Aloha St
- 1212 S Jackson St
- 524 Madison St
- 532 Madison St
- 1307 Deborah Dr
- 541 Jefferson St
- 1210 Wetter Way
- 590 Brearcliffe Dr
- 728 Lincoln St
- 275 Howell Ave
- 195 Howell Ave
Your Personal Tour Guide
Ask me questions while you tour the home.