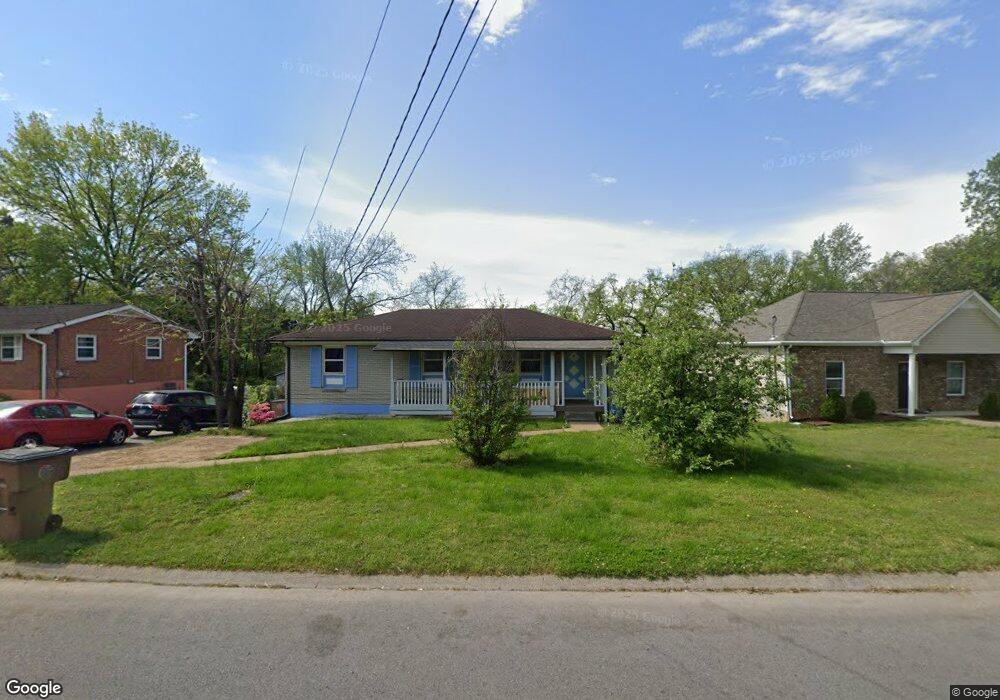
743 Reeves Rd Antioch, TN 37013
Estimated Value: $338,138 - $380,000
3
Beds
1
Bath
2,200
Sq Ft
$164/Sq Ft
Est. Value
About This Home
This home is located at 743 Reeves Rd, Antioch, TN 37013 and is currently estimated at $361,785, approximately $164 per square foot. 743 Reeves Rd is a home located in Davidson County with nearby schools including J.E. Moss Elementary School, Apollo Middle School, and Antioch High School.
Ownership History
Date
Name
Owned For
Owner Type
Purchase Details
Closed on
Jul 16, 2025
Sold by
Flores Rosa and Molina Amanda
Bought by
Molina Amanda
Current Estimated Value
Purchase Details
Closed on
Nov 30, 1998
Sold by
Gipson Randy R
Bought by
Flores Oscar M and Flores Rosa N
Home Financials for this Owner
Home Financials are based on the most recent Mortgage that was taken out on this home.
Original Mortgage
$93,374
Interest Rate
6.77%
Mortgage Type
FHA
Purchase Details
Closed on
Mar 8, 1994
Sold by
Merry Scot O
Bought by
Gipson Randy R
Create a Home Valuation Report for This Property
The Home Valuation Report is an in-depth analysis detailing your home's value as well as a comparison with similar homes in the area
Home Values in the Area
Average Home Value in this Area
Purchase History
| Date | Buyer | Sale Price | Title Company |
|---|---|---|---|
| Molina Amanda | -- | None Listed On Document | |
| Flores Oscar M | $93,500 | -- | |
| Gipson Randy R | $72,900 | -- |
Source: Public Records
Mortgage History
| Date | Status | Borrower | Loan Amount |
|---|---|---|---|
| Previous Owner | Flores Oscar M | $93,374 |
Source: Public Records
Tax History Compared to Growth
Tax History
| Year | Tax Paid | Tax Assessment Tax Assessment Total Assessment is a certain percentage of the fair market value that is determined by local assessors to be the total taxable value of land and additions on the property. | Land | Improvement |
|---|---|---|---|---|
| 2024 | $1,581 | $48,575 | $10,750 | $37,825 |
| 2023 | $1,581 | $48,575 | $10,750 | $37,825 |
| 2022 | $1,581 | $48,575 | $10,750 | $37,825 |
| 2021 | $1,597 | $48,575 | $10,750 | $37,825 |
| 2020 | $1,449 | $34,325 | $7,250 | $27,075 |
| 2019 | $1,083 | $34,325 | $7,250 | $27,075 |
| 2018 | $1,083 | $34,325 | $7,250 | $27,075 |
| 2017 | $1,083 | $34,325 | $7,250 | $27,075 |
| 2016 | $1,141 | $25,275 | $4,375 | $20,900 |
| 2015 | $1,141 | $25,275 | $4,375 | $20,900 |
| 2014 | $1,141 | $25,275 | $4,375 | $20,900 |
Source: Public Records
Map
Nearby Homes
- 4751 Bowfield Dr
- 4717 Mcbride Rd
- 708 Richards Rd
- 2601 Una Antioch Pike
- 117 Apollo Ct W
- 4660 Fanning Dr
- 0 Ottenville Ave Unit RTC3007810
- 4836 Barclay Square Dr
- 408 Barclay Square Cir
- 5118 Mount View Rd
- 0 Hickory Hollow Pkwy
- 5088 Hickory Hollow Pkwy
- 104 Pepper Ridge Cir Unit 104
- 5012 Pebble Creek Dr
- 216 Pepper Ridge Cir
- 4708 Long Branch
- 4712 Longbranch
- 934 Governors Ct Unit 112
- 517 Danley Ct
- 716 Muskhogean Ct