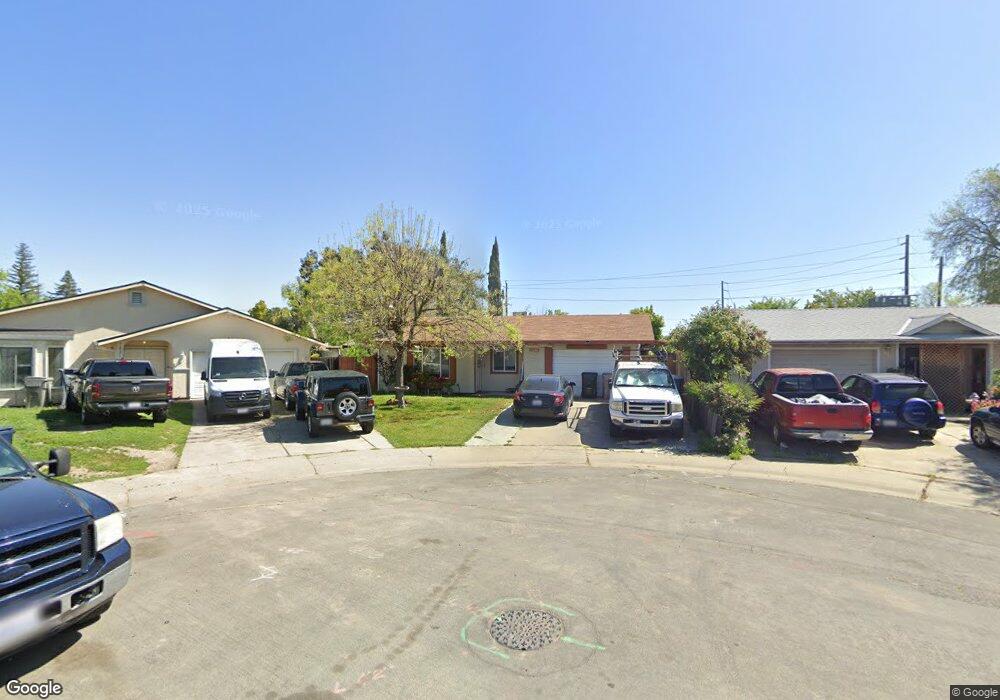
7435 Poirier Way Sacramento, CA 95822
Meadowview NeighborhoodEstimated Value: $342,000 - $410,644
3
Beds
2
Baths
1,243
Sq Ft
$305/Sq Ft
Est. Value
About This Home
This home is located at 7435 Poirier Way, Sacramento, CA 95822 and is currently estimated at $379,661, approximately $305 per square foot. 7435 Poirier Way is a home located in Sacramento County with nearby schools including Rosa Parks Elementary School, Luther Burbank High School, and Capitol Collegiate Academy.
Ownership History
Date
Name
Owned For
Owner Type
Purchase Details
Closed on
Oct 20, 2009
Sold by
Contreras Eduardo
Bought by
Rodriguez Felipe Jesus
Current Estimated Value
Home Financials for this Owner
Home Financials are based on the most recent Mortgage that was taken out on this home.
Original Mortgage
$68,240
Outstanding Balance
$44,491
Interest Rate
5.05%
Mortgage Type
FHA
Estimated Equity
$335,170
Purchase Details
Closed on
Jun 11, 2004
Sold by
Contreras Eduardo and Gallego Sergio
Bought by
Contreras Eduardo
Home Financials for this Owner
Home Financials are based on the most recent Mortgage that was taken out on this home.
Original Mortgage
$164,000
Interest Rate
6.45%
Mortgage Type
New Conventional
Purchase Details
Closed on
Apr 11, 2002
Sold by
Singh Prem and Singh Kamal
Bought by
Contreras Eduardo and Gallego Sergio
Home Financials for this Owner
Home Financials are based on the most recent Mortgage that was taken out on this home.
Original Mortgage
$134,105
Interest Rate
6.87%
Mortgage Type
FHA
Create a Home Valuation Report for This Property
The Home Valuation Report is an in-depth analysis detailing your home's value as well as a comparison with similar homes in the area
Home Values in the Area
Average Home Value in this Area
Purchase History
| Date | Buyer | Sale Price | Title Company |
|---|---|---|---|
| Rodriguez Felipe Jesus | $69,500 | Fidelity National Title Co | |
| Contreras Eduardo | -- | -- | |
| Contreras Eduardo | $136,000 | North American Title Co |
Source: Public Records
Mortgage History
| Date | Status | Borrower | Loan Amount |
|---|---|---|---|
| Open | Rodriguez Felipe Jesus | $68,240 | |
| Previous Owner | Contreras Eduardo | $164,000 | |
| Previous Owner | Contreras Eduardo | $134,105 | |
| Closed | Contreras Eduardo | $8,160 |
Source: Public Records
Tax History Compared to Growth
Tax History
| Year | Tax Paid | Tax Assessment Tax Assessment Total Assessment is a certain percentage of the fair market value that is determined by local assessors to be the total taxable value of land and additions on the property. | Land | Improvement |
|---|---|---|---|---|
| 2025 | $1,307 | $89,693 | $27,097 | $62,596 |
| 2024 | $1,307 | $87,935 | $26,566 | $61,369 |
| 2023 | $1,270 | $86,212 | $26,046 | $60,166 |
| 2022 | $1,262 | $84,523 | $25,536 | $58,987 |
| 2021 | $1,201 | $82,867 | $25,036 | $57,831 |
| 2020 | $1,201 | $82,019 | $24,780 | $57,239 |
| 2019 | $1,177 | $80,412 | $24,295 | $56,117 |
| 2018 | $1,147 | $78,836 | $23,819 | $55,017 |
| 2017 | $1,127 | $77,291 | $23,352 | $53,939 |
| 2016 | $1,076 | $75,777 | $22,895 | $52,882 |
| 2015 | $1,054 | $74,640 | $22,552 | $52,088 |
| 2014 | $1,037 | $73,179 | $22,111 | $51,068 |
Source: Public Records
Map
Nearby Homes
- 7489 24th St
- 2681 Meadowvale Ave
- 7527 24th St
- 7417 Flores Way
- 87 Pulsar Cir
- 7588 San Felice Cir
- 7559 Thorpe Way
- 2941 Gardendale Rd
- 2163 Amanda Way
- 7529 Skelton Way
- 59 Quasar Cir
- 7585 Twilight Dr
- 2121 Oneil Way
- 7508 Hither Way
- 2154 63rd Ave
- 7621 23rd St
- 7477 21st St
- 2183 Meadowview Rd
- 2233 Babette Way
- 7528 Georgica Way
- 7431 Poirier Way
- 7439 Poirier Way
- 7446 24th St
- 7442 24th St
- 7440 24th St
- 7452 24th St
- 7443 Poirier Way
- 7432 Poirier Way
- 7464 24th St
- 7436 Poirier Way
- 7466 24th St
- 7440 Poirier Way
- 7447 Poirier Way
- 7468 24th St
- 7444 Poirier Way
- 7441 Balfour Way
- 7435 Balfour Way
- 7451 Poirier Way
- 7472 24th St
- 7461 24th St