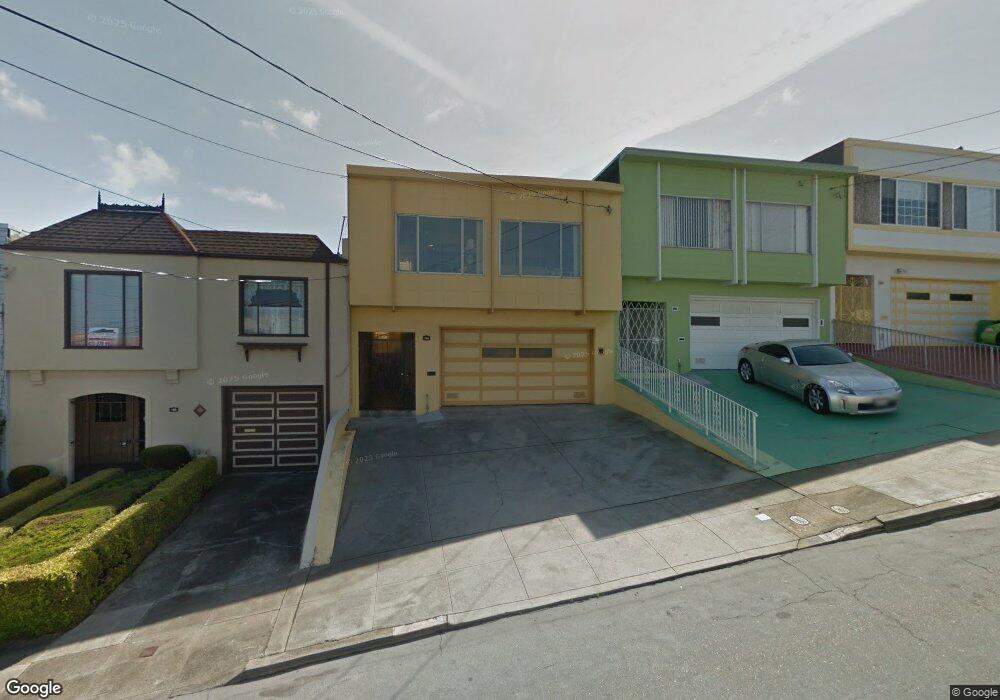
744 Head St San Francisco, CA 94132
Merced Heights NeighborhoodEstimated Value: $1,259,000 - $1,461,000
3
Beds
2
Baths
1,438
Sq Ft
$933/Sq Ft
Est. Value
About This Home
This home is located at 744 Head St, San Francisco, CA 94132 and is currently estimated at $1,341,828, approximately $933 per square foot. 744 Head St is a home located in San Francisco County with nearby schools including Commodore Sloat Elementary School, Aptos Middle School, and Stratford School.
Ownership History
Date
Name
Owned For
Owner Type
Purchase Details
Closed on
Sep 7, 2001
Sold by
Goodson Elmon E and Goodson Leona J
Bought by
Goodson Elmon E and Goodson Leona J
Current Estimated Value
Home Financials for this Owner
Home Financials are based on the most recent Mortgage that was taken out on this home.
Original Mortgage
$71,400
Interest Rate
6.56%
Purchase Details
Closed on
Oct 18, 1999
Sold by
Goodson Elmon E & Leona J Trs
Bought by
Goodson Elmon E and Goodson Leona J
Create a Home Valuation Report for This Property
The Home Valuation Report is an in-depth analysis detailing your home's value as well as a comparison with similar homes in the area
Home Values in the Area
Average Home Value in this Area
Purchase History
| Date | Buyer | Sale Price | Title Company |
|---|---|---|---|
| Goodson Elmon E | -- | Fidelity National Title Co | |
| Goodson Elmon E | -- | -- |
Source: Public Records
Mortgage History
| Date | Status | Borrower | Loan Amount |
|---|---|---|---|
| Previous Owner | Goodson Elmon E | $71,400 |
Source: Public Records
Tax History
| Year | Tax Paid | Tax Assessment Tax Assessment Total Assessment is a certain percentage of the fair market value that is determined by local assessors to be the total taxable value of land and additions on the property. | Land | Improvement |
|---|---|---|---|---|
| 2025 | $1,067 | $90,376 | $15,846 | $74,530 |
| 2024 | $1,067 | $88,608 | $15,538 | $73,070 |
| 2023 | $1,052 | $86,876 | $15,236 | $71,640 |
| 2022 | $1,033 | $85,177 | $14,940 | $70,237 |
| 2021 | $1,016 | $83,511 | $14,650 | $68,861 |
| 2020 | $1,018 | $82,659 | $14,502 | $68,157 |
| 2019 | $985 | $81,043 | $14,220 | $66,823 |
| 2018 | $954 | $79,444 | $13,938 | $65,506 |
| 2017 | $942 | $77,890 | $13,666 | $64,224 |
| 2016 | $897 | $76,368 | $13,400 | $62,968 |
| 2015 | $1,152 | $75,224 | $13,200 | $62,024 |
| 2014 | $863 | $73,754 | $12,944 | $60,810 |
Source: Public Records
Map
Nearby Homes
- 224 Shields St
- 329 Faxon Ave
- 408 Shields St
- 230 Ashton Ave
- 759 Lakeview Ave
- 219 Jules Ave
- 725 Lakeview Ave
- 161 Miramar Ave
- 337 Jules Ave
- 1171 Capitol Ave
- 527 Faxon Ave
- 239 Bright St
- 270 Lobos St
- 90 Entrada Ct
- 406 Head St
- 275 Miramar Ave
- 1 Head St
- 271 Granada Ave
- 234 Granada Ave
- 20 Dorado Terrace Unit C
Your Personal Tour Guide
Ask me questions while you tour the home.