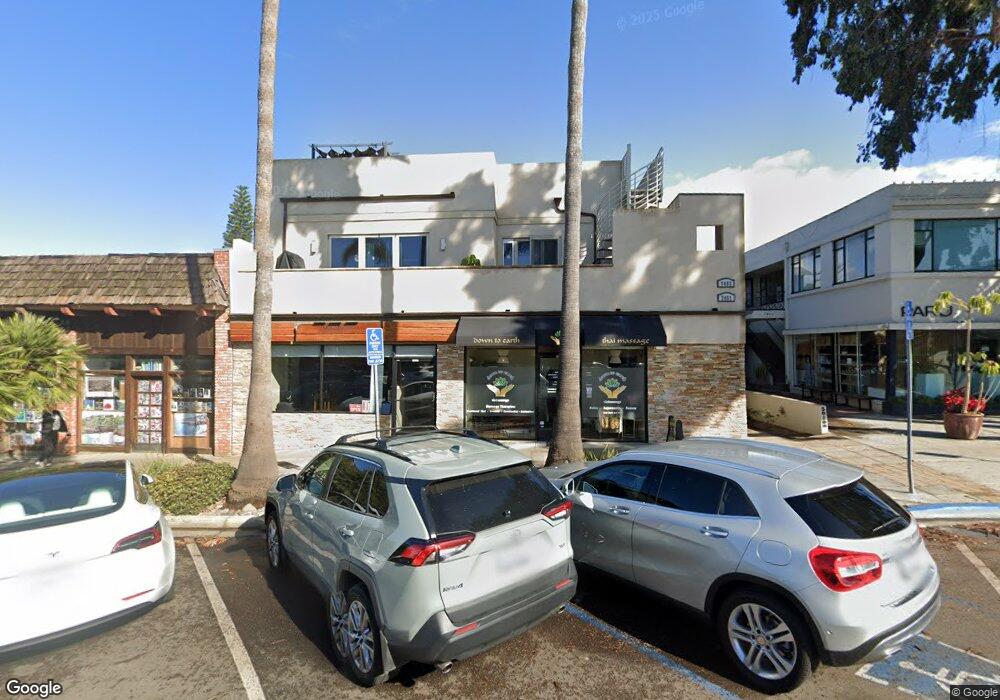
7449 Girard Ave La Jolla, CA 92037
The Village NeighborhoodEstimated Value: $1,414,692
--
Bed
--
Bath
1,640
Sq Ft
$863/Sq Ft
Est. Value
About This Home
This home is located at 7449 Girard Ave, La Jolla, CA 92037 and is currently estimated at $1,414,692, approximately $862 per square foot. 7449 Girard Ave is a home located in San Diego County with nearby schools including La Jolla Elementary School, Muirlands Middle School, and La Jolla High School.
Ownership History
Date
Name
Owned For
Owner Type
Purchase Details
Closed on
Nov 13, 2013
Sold by
Moussighi Massoud and Moussighi Symphony Melody
Bought by
Mash 2013 Llc
Current Estimated Value
Purchase Details
Closed on
Apr 2, 2013
Sold by
Vista Girard Llc
Bought by
Moussighi Massoud and Moussighi Symphony Melody
Purchase Details
Closed on
Sep 30, 2009
Sold by
Irwin David J
Bought by
Vista Girard Llc
Purchase Details
Closed on
Jul 9, 2004
Sold by
Irwin David John and Irwin David J
Bought by
Irwin David J
Purchase Details
Closed on
Mar 25, 2003
Sold by
Irwin Sally Parker
Bought by
Irwin Daniel Barrett
Home Financials for this Owner
Home Financials are based on the most recent Mortgage that was taken out on this home.
Original Mortgage
$325,000
Interest Rate
5.75%
Mortgage Type
Credit Line Revolving
Create a Home Valuation Report for This Property
The Home Valuation Report is an in-depth analysis detailing your home's value as well as a comparison with similar homes in the area
Home Values in the Area
Average Home Value in this Area
Purchase History
| Date | Buyer | Sale Price | Title Company |
|---|---|---|---|
| Mash 2013 Llc | -- | None Available | |
| Moussighi Massoud | $600,000 | Chicago Title Company | |
| Vista Girard Llc | -- | None Available | |
| Vista Girard Llc | -- | None Available | |
| Irwin David J | -- | -- | |
| Irwin Daniel Barrett | -- | Chicago Title Co | |
| Irwin David John | -- | Chicago Title Co | |
| Irwin David John | $275,000 | Chicago Title Co |
Source: Public Records
Mortgage History
| Date | Status | Borrower | Loan Amount |
|---|---|---|---|
| Previous Owner | Irwin David John | $325,000 |
Source: Public Records
Tax History Compared to Growth
Tax History
| Year | Tax Paid | Tax Assessment Tax Assessment Total Assessment is a certain percentage of the fair market value that is determined by local assessors to be the total taxable value of land and additions on the property. | Land | Improvement |
|---|---|---|---|---|
| 2025 | $9,537 | $738,846 | $369,423 | $369,423 |
| 2024 | $9,537 | $724,360 | $362,180 | $362,180 |
| 2023 | $9,322 | $710,158 | $355,079 | $355,079 |
| 2022 | $9,074 | $696,234 | $348,117 | $348,117 |
| 2021 | $8,999 | $682,584 | $341,292 | $341,292 |
| 2020 | $8,896 | $675,586 | $337,793 | $337,793 |
| 2019 | $8,748 | $662,340 | $331,170 | $331,170 |
| 2018 | $7,665 | $649,354 | $324,677 | $324,677 |
| 2017 | $8,033 | $636,622 | $318,311 | $318,311 |
| 2016 | $7,365 | $624,140 | $312,070 | $312,070 |
| 2015 | $7,256 | $614,766 | $307,383 | $307,383 |
| 2014 | $7,142 | $602,724 | $301,362 | $301,362 |
Source: Public Records
Map
Nearby Homes
- 7452 Herschel Ave
- 7447 Herschel Ave
- 7376 Fay Ave
- 7372 Fay Ave
- 1138 Virginia Way
- 7310 Fay Ave
- 1040 Genter St Unit 103
- 1040 Genter St Unit 104
- 7560 Eads Ave Unit 12
- 935 Genter St Unit 306
- 7601 Eads Ave
- 1001 Genter St Unit 2H
- 7216 Fay Ave
- 7520 Draper Ave Unit 3
- 7214 Fay Ave
- 726 Silver St
- 708 Silver St
- 718 Silver St
- 7733 Girard Ave Unit 13
- 7635 Draper Ave Unit LU4
- 7441 7441 Girard Av B
- 7447 Girard Ave
- 7445 Girard Ave
- 7451 Girard Ave
- 7453 Girard Ave
- 7463 Girard Ave
- 7434 Girard Ave
- 7432 Girard Ave
- 1027 Pearl St
- 7434 Herschel Ave
- 7434 Herschel Ave Unit 9
- 7434 Herschel Ave Unit 8
- 7434 Herschel Ave Unit 7
- 7434 Herschel Ave Unit 6
- 7434 Herschel Ave Unit 5
- 7434 Herschel Ave Unit 4
- 7434 Herschel Ave Unit 3
- 7434 Herschel Ave Unit 2
- 7434 Herschel Ave Unit 1
- 7444 Herschel Ave