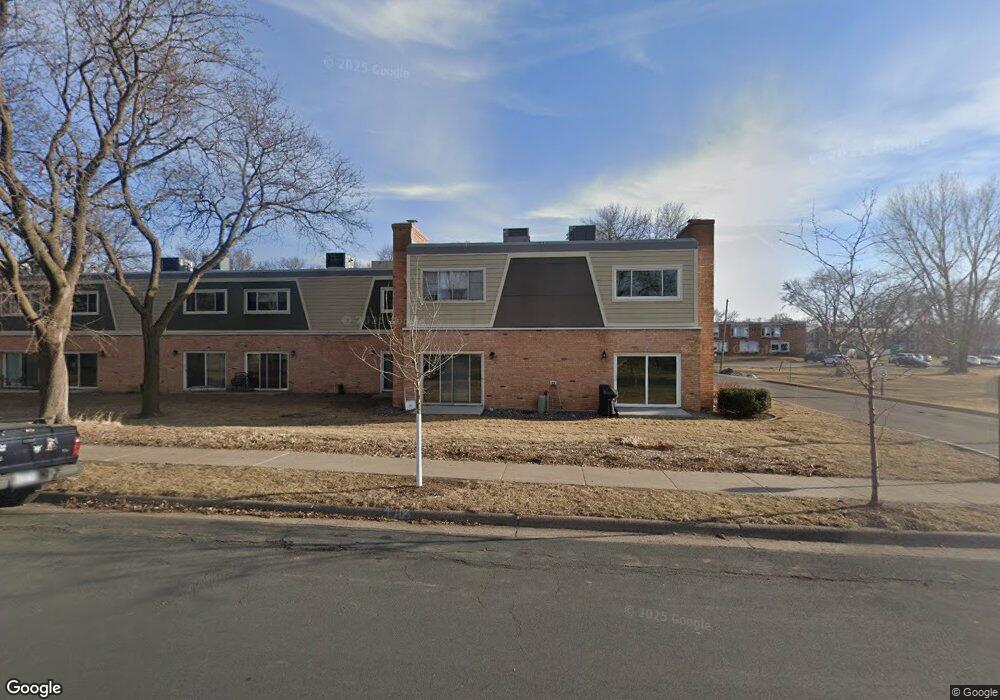
7449 W Franklin Ave Saint Louis Park, MN 55426
Willow Park NeighborhoodEstimated Value: $217,924 - $219,000
2
Beds
2
Baths
455
Sq Ft
$481/Sq Ft
Est. Value
About This Home
This home is located at 7449 W Franklin Ave, Saint Louis Park, MN 55426 and is currently estimated at $218,731, approximately $480 per square foot. 7449 W Franklin Ave is a home located in Hennepin County with nearby schools including Aquila Elementary School, St. Louis Park Middle School, and St. Louis Park High School.
Ownership History
Date
Name
Owned For
Owner Type
Purchase Details
Closed on
Aug 27, 2020
Sold by
Bentley Robert J and Bentley Rachel
Bought by
Chavis Louise R V
Current Estimated Value
Home Financials for this Owner
Home Financials are based on the most recent Mortgage that was taken out on this home.
Original Mortgage
$174,999
Outstanding Balance
$155,300
Interest Rate
2.9%
Mortgage Type
New Conventional
Estimated Equity
$63,431
Purchase Details
Closed on
Jun 4, 2019
Sold by
Starinets Maksim and Starinets Olena V
Bought by
Bentley Robert J
Home Financials for this Owner
Home Financials are based on the most recent Mortgage that was taken out on this home.
Original Mortgage
$169,750
Interest Rate
4.2%
Mortgage Type
New Conventional
Purchase Details
Closed on
Feb 9, 2006
Sold by
The Mary Lou Lawrence Family Living Tr
Bought by
Starinets Maksim and Starinets Olena
Create a Home Valuation Report for This Property
The Home Valuation Report is an in-depth analysis detailing your home's value as well as a comparison with similar homes in the area
Home Values in the Area
Average Home Value in this Area
Purchase History
| Date | Buyer | Sale Price | Title Company |
|---|---|---|---|
| Chavis Louise R V | $192,500 | All American Title Co Inc | |
| Bentley Robert J | $175,000 | Pillar Title Services | |
| Starinets Maksim | $172,800 | -- |
Source: Public Records
Mortgage History
| Date | Status | Borrower | Loan Amount |
|---|---|---|---|
| Open | Chavis Louise R V | $174,999 | |
| Previous Owner | Bentley Robert J | $169,750 |
Source: Public Records
Tax History Compared to Growth
Tax History
| Year | Tax Paid | Tax Assessment Tax Assessment Total Assessment is a certain percentage of the fair market value that is determined by local assessors to be the total taxable value of land and additions on the property. | Land | Improvement |
|---|---|---|---|---|
| 2024 | $2,479 | $202,200 | $29,900 | $172,300 |
| 2023 | $2,269 | $188,200 | $27,900 | $160,300 |
| 2022 | $2,125 | $200,400 | $29,700 | $170,700 |
| 2021 | $2,092 | $177,600 | $26,400 | $151,200 |
| 2020 | $2,135 | $176,600 | $26,300 | $150,300 |
| 2019 | $1,860 | $173,400 | $25,900 | $147,500 |
| 2018 | $1,727 | $150,500 | $22,500 | $128,000 |
| 2017 | $1,520 | $127,900 | $19,200 | $108,700 |
| 2016 | $1,356 | $114,100 | $17,200 | $96,900 |
| 2015 | $1,012 | $90,400 | $13,700 | $76,700 |
| 2014 | -- | $79,900 | $12,200 | $67,700 |
Source: Public Records
Map
Nearby Homes
- 7414 W 22nd St Unit 114
- 7414 W 22nd St Unit 212
- 1611 Oregon Ave S
- 1605 Pennsylvania Ave S
- 2054 Louisiana Ave S
- 2016 Kentucky Ave S
- 1409 Nevada Ave S
- 2205 Texas Ave S
- 2221 Texas Ave S
- 7009 Cedar Lake Rd S
- 1464 Idaho Ave S
- 1350 Westwood Hills Rd
- 1417 Jersey Ave S
- 1304 Westwood Hills Rd
- 6926 W 24th St
- 2575 Quebec Ave S
- 7907 W 25th St
- 6821 W 24th St
- 2608 Kentucky Ave S
- 8016 Cedar Lake Rd S
- 7453 W Franklin Ave
- 7437 W Franklin Ave Unit 169
- 7357 7357 W Franklin-Avenue-
- 7433 W Franklin Ave
- 7433 W Franklin Ave
- 7429 W Franklin Ave
- 7425 W Franklin Ave Unit 172
- 1851 Oregon Ave S
- 7417 W Franklin Ave
- 7417 W Franklin Ave
- 7439 W Franklin Ave
- 7439 W Franklin Ave
- 7435 W Franklin Ave
- 7435 W Franklin Ave Unit 206
- 7447 W Franklin Ave
- 7451 W Franklin Ave Unit 203
- 7431 W Franklin Ave
- 7431 W Franklin Ave Unit 207
- 7427 W Franklin Ave Unit 208
- 7427 W Franklin Ave